Steemit: Technical analysis Steem Dollar
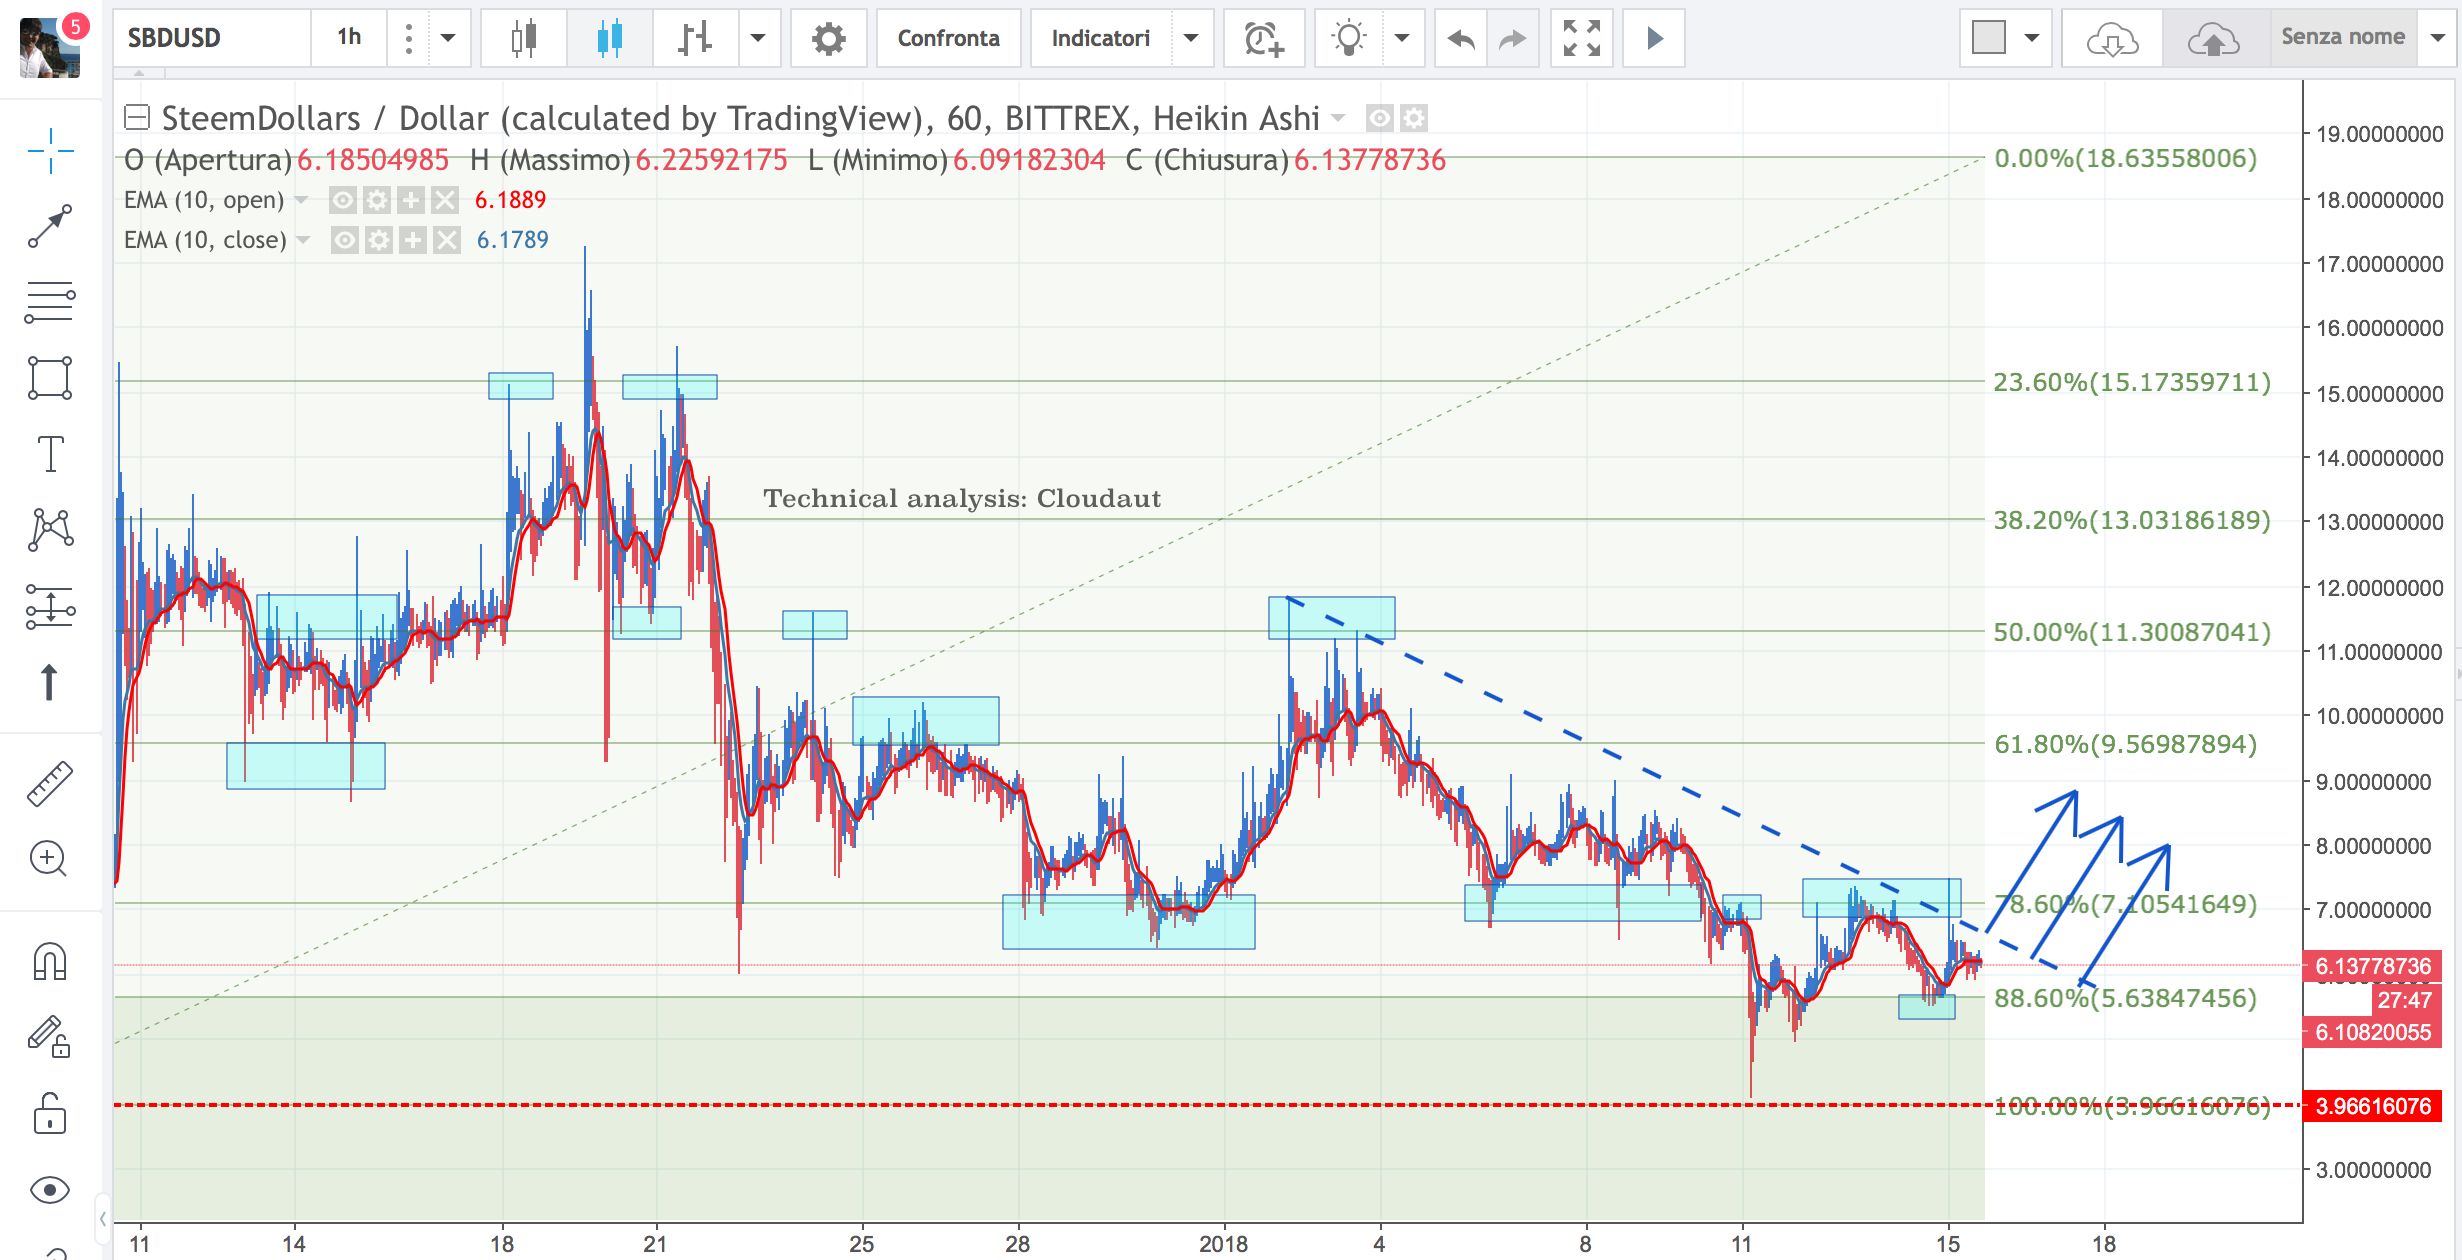
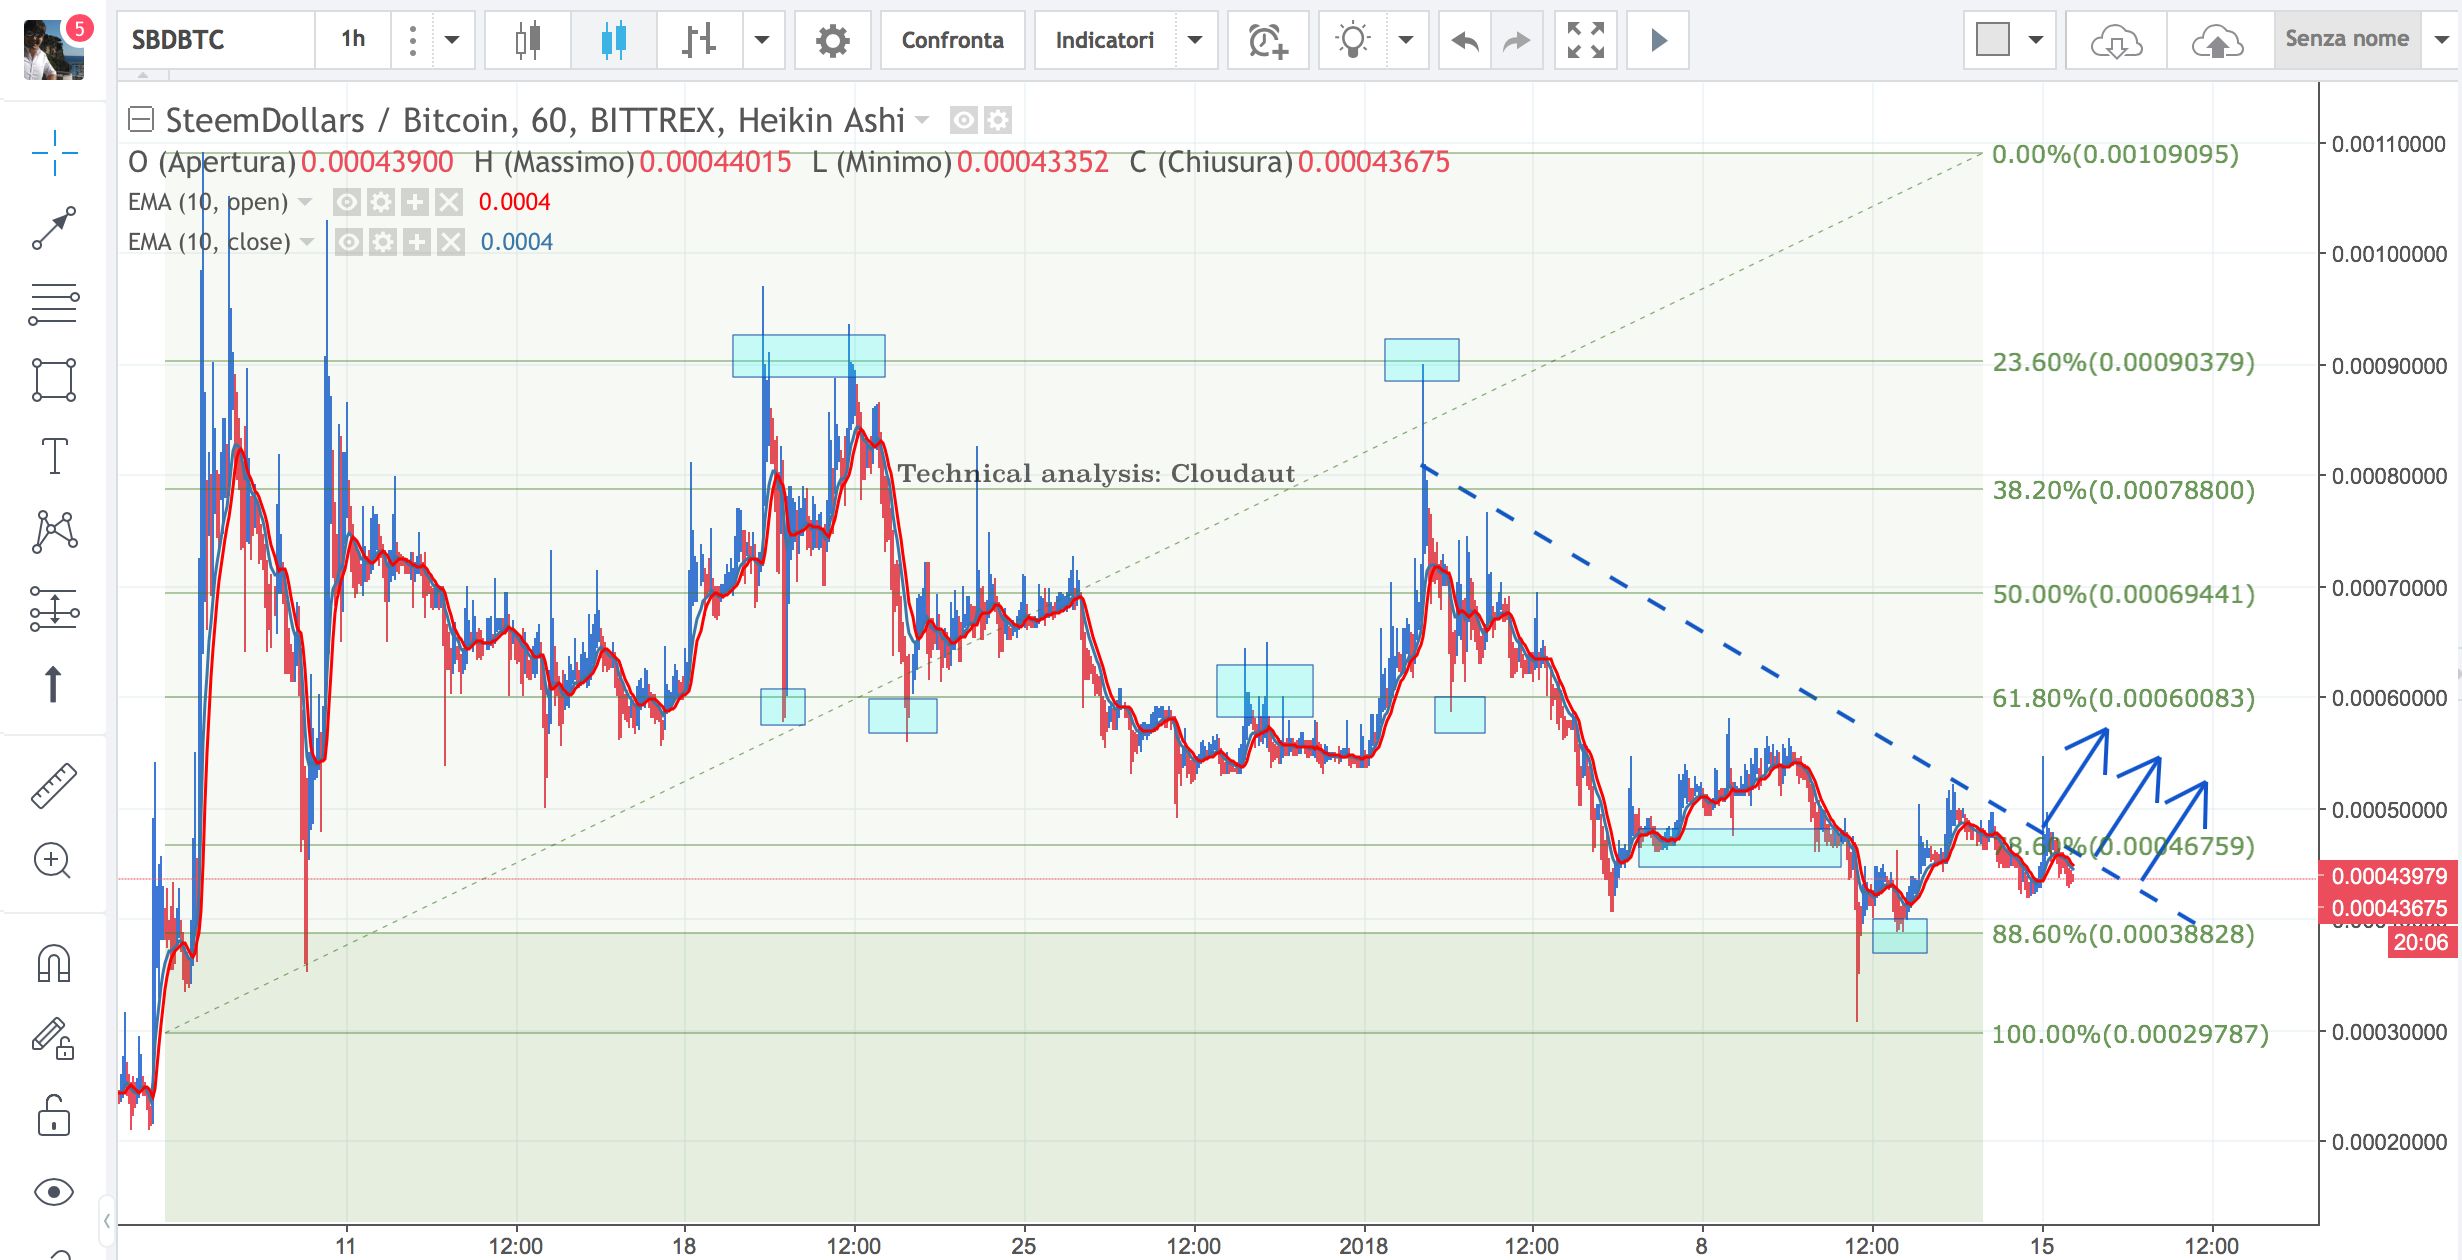
Above you can see the Steemit charts and more precisely Steem Dollar with the US dollar (SBD / USD) and Steem dollar with the bitcoin (SBD / BTC).
They are very similar to each other, and above all they tend to respect Fibonacci levels a lot.
Currently the Steem Dollar is moving in both cases between the level 78.6 and 88.6 of Fibonacci and in both cases it has retraced 100% which is the level from which the rally phase that led him from 4 dollars to 17 dollars and then follow a descending path that led him to the current 6 dollars.
The blue squares represent the levels of tests performed on the Fibonacci levels, and I must say that they are really many.
In both cases I designed the dynamic resistance and my idea of trading is just waiting for the break of this resistance that could bring the price at least to area 68.8 Fibonacci that is close to 10 dollars. The breaking of the dynamic resistances after touching the minimum levels are always good points where you can enter to try to be able to take the next rally phase, if there is.
Disclaimer
Please note that this technical analysis is my idea of trading and therefore if you decide to invest you will do so by relieving me from any responsibility.
Steemit: analisi tecnica dello steem dollar
Qui sopra potete vedere i grafici di Steemit e più precisamente di Steem Dollar con il dollaro americano (SBD/USD) e di Steem dollar con il bitcoin (SBD/BTC).
Sono molto simili tra loro, e soprattutto tendono a rispettare molto i livelli di Fibonacci.
Attualmente lo Steem Dollar si sta muovendo in entrambi i casi tra il livello 78.6 e 88.6 di Fibonacci ed in entrambi i casi ha ritracciato al 100% che è il livello dal quale è partita la fase rally che lo ha portato da 4 dollari a 17 dollari per poi seguire un percorso discendente che lo ha portato agli attuali 6 dollari.
I quadrati celesti rappresentano i livelli di test effettuati sui livelli di Fibonacci, e devo dire che sono davvero tanti.
In entrambi i casi ho disegnato la resistenza dinamica e la mia idea di trading sta proprio nell'aspettare la rottura di questa resistenza che potrebbe portare il prezzo almeno verso area 68.8 di Fibonacci che è prossima ai 10 dollari. La rottura delle resistenze dinamiche dopo aver toccato dei livelli di minimo sono sempre degli ottimi punti nei quali si può entrare per tentare di riuscire a prendere la prossima fase rally, sempre che ci sia.
Disclaimer
Si precisa che questa analisi tecnica rappresenta una mia idea di trading e pertanto se decidete di investire lo farete sollevandomi da ogni responsabilità.