well, I'm exaggerating, but yea.. it was time to get out.
This is a weird, pivotal time for SPX. (S&P 500) The market is very very, extremely low in terms of VIX (the fear index), which means people are more scared to put their money in the market right now.. not very confident in it at all. I think that's why the FED is probably concerned and trying to turn things around. That might be why there is an increase in FED news recently.. I can't remember the last time Powell, the head chair at the FED, spoke TWICE in the same week. Usually he just talks once and then lets his underlings talk if there's more to say later.
Whatever it is.. I'm not trying to figure out or predict how the news works or anything.. just how the market reacts or behaves because of such news, and today I got lucky and got in and out fast enough to make some profit!
Here's what I saw on the hourly chart this morning..
The market is falling/correcting to middle (100ema). It had been very bullish in previous days and now it is heading down to the average. My concern was that it had already dropped most of the way to middle, and so might turn back up now.

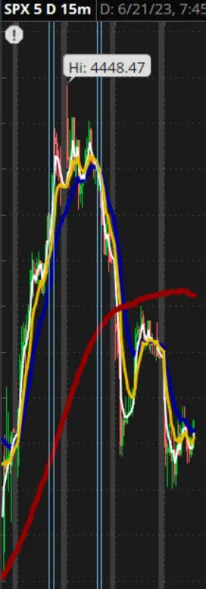
We get conflicting bullish/bearish signals.. on the hourly chart price is above the average which means it's bullish, but here on the 15m price is below the average, meaning it bearish. The mixed signals are something that is quite rare.. only happens when their is a BIG shift in the market.. in fact, I've been trading since end of 2020 and I've never noticed it happening before.
see how the average is turning down now, or it will level out if price does start up again. very iffy time to trade.
This is also very odd.. not only is Powell speaking a day apart, but there is also unemployment news in the middle of that, which on makes the market MORE tense!

I thought for sure price was going up for air, and would run to touch the average. It did.. and I tried to get in a couple times, but price never paused and dipped enough for me to get filled.
I'm showing the 2 times I did put in an entry order, but I cancelled when price was so close already to the average. I would try and catch the turn of this short rise up.

I dropped down to the 1m to get a closer look at price action.. this one would be more of a quickie trade..
*I would enter a CCS (call credit spread) to capture profit on a DOWN move. Price was turning now, but I wait until the signal is stronger and price breaks through the 17ema. (the blue average)

Look at what price did right after that last snap.. good thing I wait for that stronger signal..

Price did finally give me that strong signal ten minutes later. I was in at a pretty nice delta..


See how price broke through the 17ema, telling me to sell now..

That was visible on the 1m chart, but on the 5m price has just touched the middle average. (yellow line) This is why I like to enter on the 1m chart for these quick trades.

If price continued to fall at it's current rate, there'd be just enough time for it to hit my target before power hour..

I was getting nervous (not really), and didn't want to risk losing my lucky catch on power hour and some big bulls that might interfere.

Turns out that if I had just waited ten minutes more, I could've won the full target.. meh, what's an extra $30, right?? :P

but this is what I saw at the time I closed..
the bulls were fighting hard and the average was strong bull, too.
