
SUMMARY
Fifteen days ago, I had posted the below chart of ARAGON (ANT/USD) trying to complete a correction. Busy as the chart might look with all the subwaves, the gist was that a potential one more lower low was on the table.
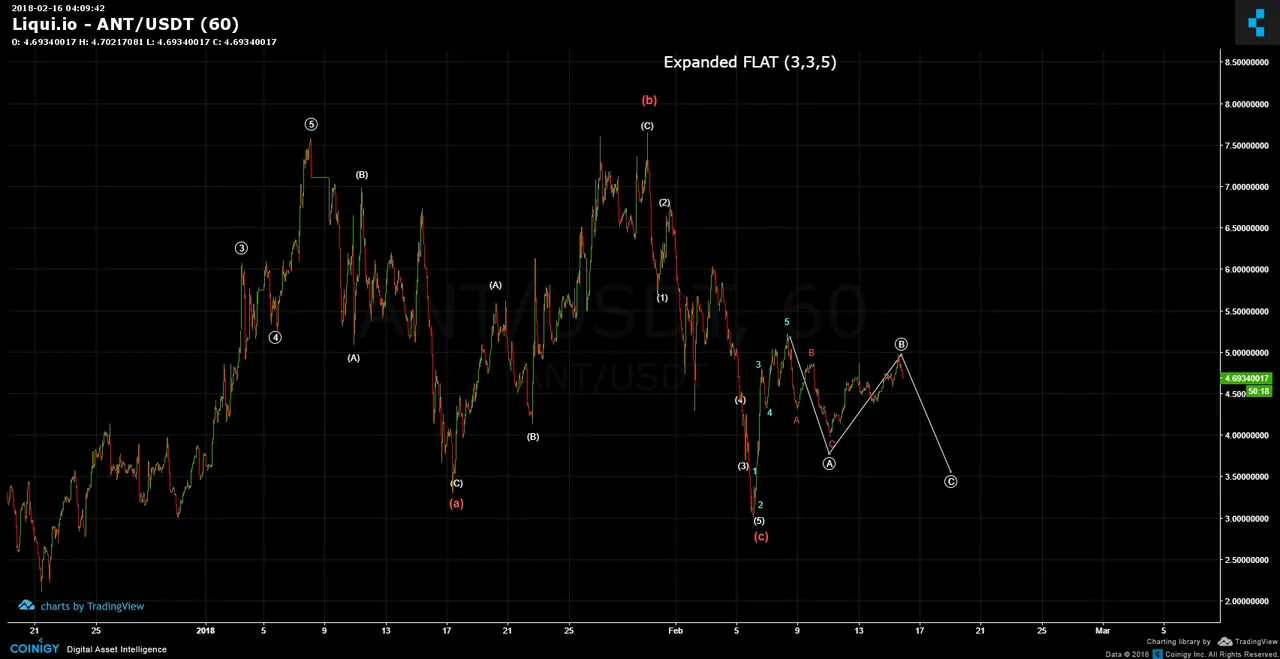
Today, the chart below shows that the lower low was tagged and has thus completed an abcde triangle from which price is currently breaking out. The lower low could also mark the bottom of current correction. The abcde pattern also allowed ANT to be a time pacman during the correction where it was allowed to execute the "Hurry Up & Wait" syndrome of Altcoins.

The first symmetrical triangle shows the effectss of what a breakout can be on the price rise. I believe it won't be too different with the second where the breakout could deliver a rise higher than its starting point, just like the first symmetrical triangle breakout. The blue line outlines a potential future price pathway towards $8.13 or higher.

Legal Disclaimer: I am not a financial advisor nor is any content in this article presented as financial advice. The information provided in this blog post and any other posts that I make and any accompanying material is for informational purposes only. It should not be considered financial or investment advice of any kind. One should consult with a financial or investment professional to determine what may be best for your individual needs. Plain English: This is only my opinion, make of it what you wish. What does this mean? It means it's not advice nor recommendation to either buy or sell anything! It's only meant for use as informative or entertainment purposes.
Please consider reviewing these Tutorials on:
Elliott Wave Counting Tutorial #1
Elliott Wave Counting Tutorial #2
Elliott Wave Counting Tutorial #3
Laddering and Buy/Sell Setups.
Laddering Example with EOS
Tutorial on the use of Fibonacci & Elliott Waves
@haejin's Trading Nuggets
Essay: Is Technical Analysis a Quantum Event?
Follow me on Twitter for Real Time Alerts!!
Follow me on StockTwits for UpDates!!
--
--

