I would like to share my thoughts on Bitcoin for my fellow Steemians who are looking at Bitcoin and wondering what the deuce is going on.
There is nothing too technical going on here in this chart it's fairly obvious TA (technical analysis), but I always find it helpful to have a clear chart with some markers to help plan for potential moves.
I'm guessing that most of us here are more interested in Steem, right, but the sad fact is that Steem isn't his/her own man/woman and needs the reassurance from Bitcoin in order to climb up again. So we must look at Bitcoin in order to understand where Steem might be heading.
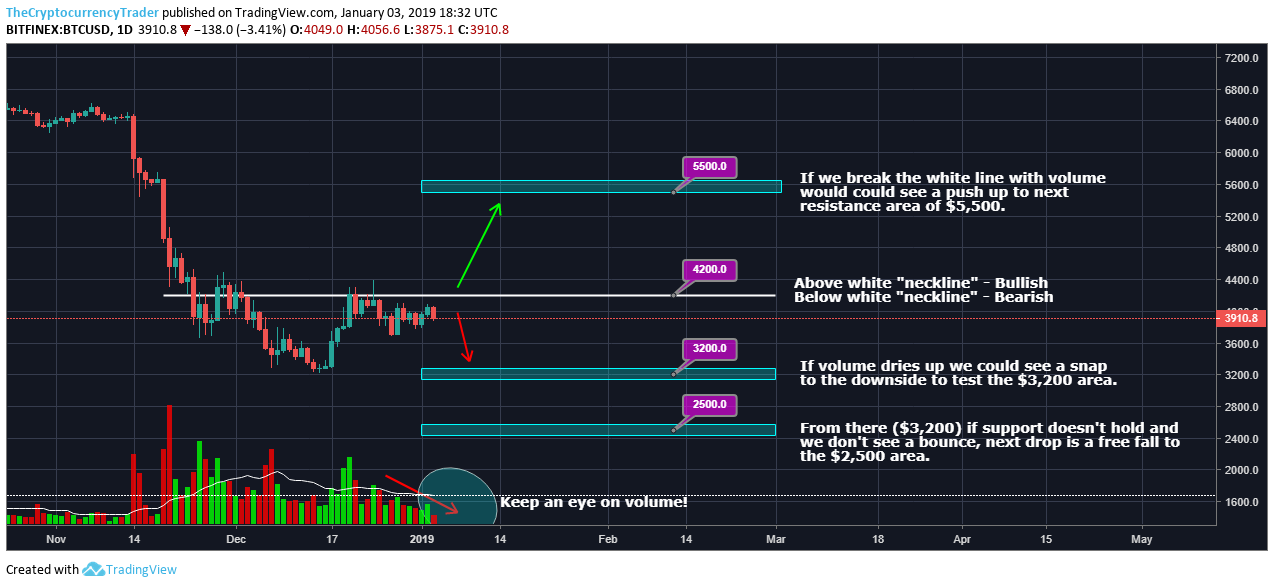
The chart should be clear to follow on it's own, but basically what I am looking at is volume and price action. We want (if you're a bull) to see high volume over the $4,000 zone and if we can break the $4,200 zone with volume we could be looking at price going up to the next support turned resistance of $5,500 area. If we stay below $4,000 and volume dries up then there is a good chance that we drop hard to $3,500 and then if we don`t see a bounce or bulls stepping in we would most likely continue down to the below $3K zone and hit $2,500.
I like to look at the daily chart as it clears up a lot of noise and reduces stress levels :-)
I hope this helps to give an overview of Bitcoin and some markers to look out for.
Play safe :-)