To kick things off, here's the 1 week chart for BCH/USD:

Next up:
BCH vs BTC shows the trading range over the past year since the fork, and that we've just hit the bottom of that range in the past couple weeks, and now turned back up again, along with MACD which has also just turned positive, so we can expect a continuation to the upside from current levels.
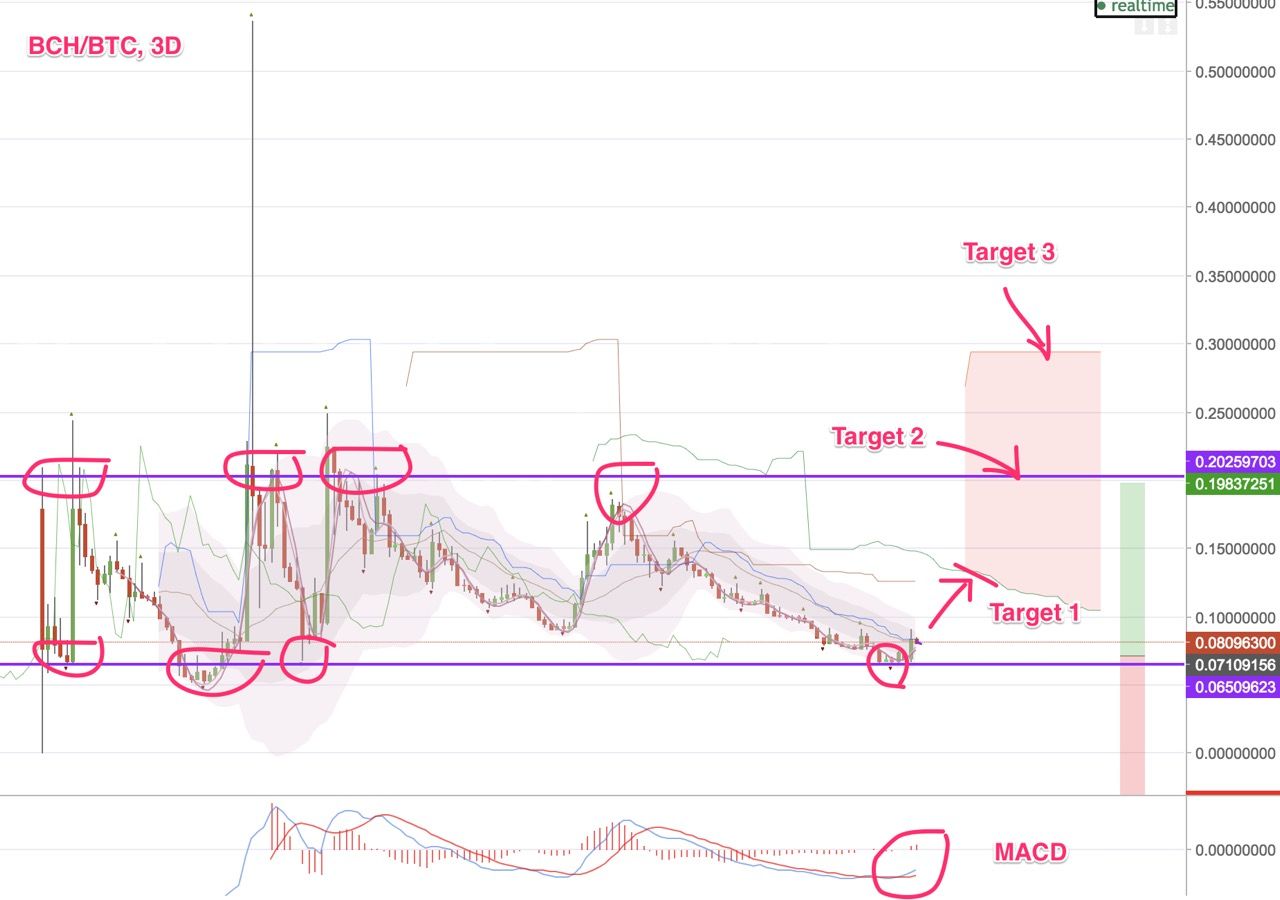
Target 1 is the resistance caused by the bottom of the thick red future cloud on the ichimoku indicator
Target 2 is the top of the trading range. Once (if) we break through that, Target 3 is the top of the Ichimoku cloud, which puts BCH at the highest ratio to BTC it's been (besides that crazy price spike back in November 17)
From today's price up to Target 2 (top of historical trading range) is a 150% price increase

BTC/USD 1 day chart is very interesting right now. With strong historical support over the past year at 6,000, and a price action pushing into the far corner of a downtrend triangle, we should be looking for a breakout in either direction quite soon.
We can also see price getting close to the ichimoku cloud which has thinned out (indicating low resistance to break through to upside)
A good entry target is the area shown in blue when price pops above the cloud after breaking out of the triangle.
Traders will be looking to enter positions around that area, ~$7,100 to ~$7,500

zoomed in speculative view shows we're in a good position to test that downtrend resistance line over the coming week
Better than a netflix soap opera. stay tuned.
Join the public telegram chat group with bitcoin.com at https://t.me/joinchat/Fi1H6RGsShn_LUWGRtKQwQ