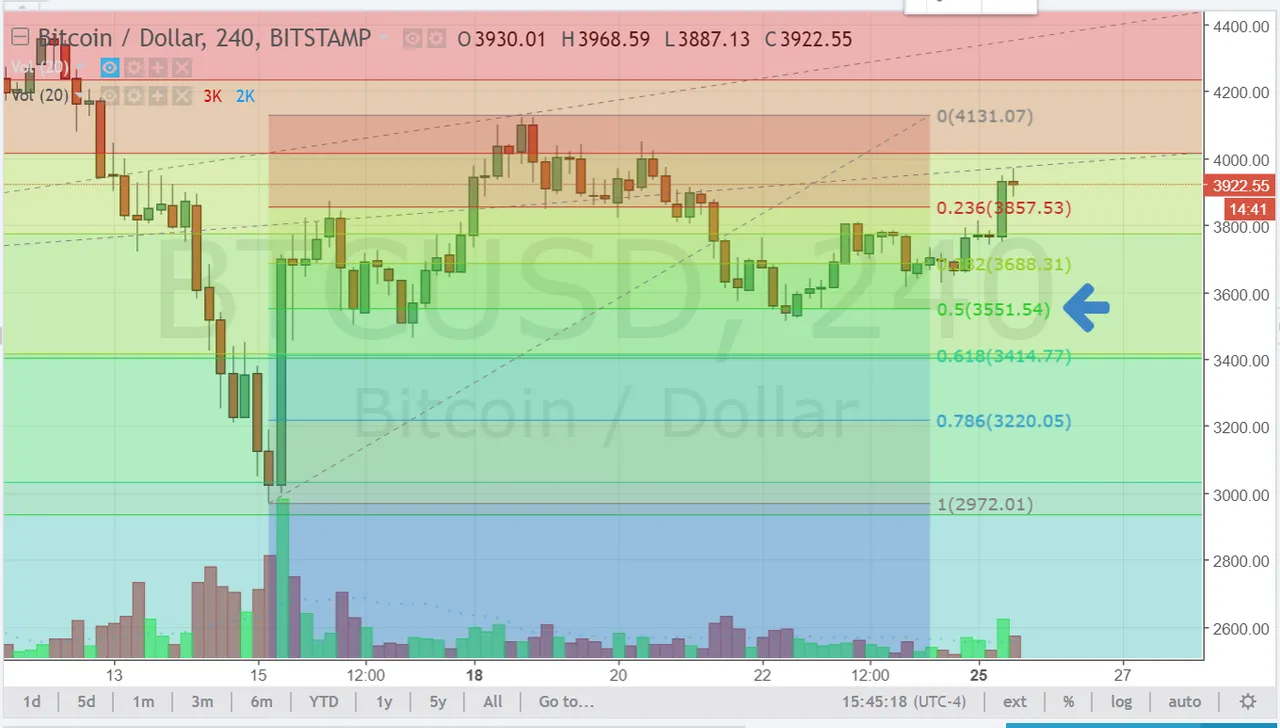
Lets take a look at the Bitcoin price action since my last update on Friday. Below is a 4-Hour chart and as we see there was a bullish engulfing candle on 9/22 at the 50% retracement. A good time to get in with a tight stop. Price then continued higher over the weekend (while I was camping with the Boy Scouts) in a beautiful ABC pattern till today.
This morning the price pushed higher above the B point from 9/23 pushing higher with more volume completing the 1-to-1 move. (see image below another 4-hour chart). So now that the price of BTC has completed the 1-to-1 ABC move we can see from the extension graphic that it has the potential to move up to the 1.618 price level of $4,093 and challenge the recent swing high of 9/18 ($4,122).

So will the price of Bitcoin move straight up to that level or take a few days to gain some energy before testing it. This is important because if it fails it could signal a overall bearish sentiment on the daily charts and push lower in price to test the high volume price on 9/5 ($2,972)
Thanks for looking at this. Questions and comments are welcome.