When playing with ascending trendlines on the 5 minute scale, I noticed this interesting ascending resistance/support trendline: when I connected the lows in the purple circles, I noticed the line was followed upstairs by 2 more support points and downwards I found 2 resistance points :

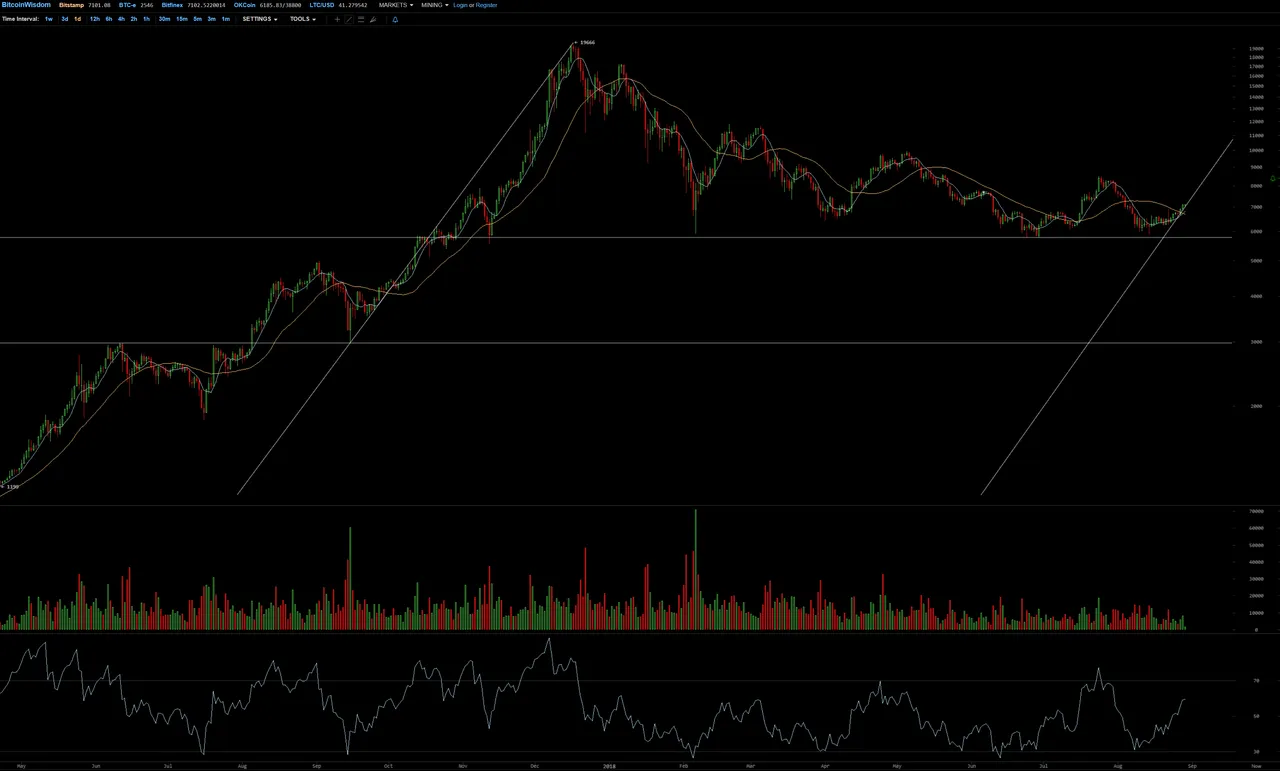
Curious to see if there would be other instances in the past that showed the same slope, I made anather interesting discovery: the ascending trendline of the 5 minute scale was exactly perpendicular to the line that connects the last part of the previous bull run from 3K to 19666 (hourly):
This made me wonder if this pattern was repeated in the past. And yes, when connecting the lows and highs of 3 previous bull runs from 2012-2013, I found the exact same slope (weekly) :

3-dayly detail :

Interesting, isn't it?