It is such a curious thing the way sometimes Pattern Recognition Techniques on TA simply works so well...
5 days ago I wrote my opinion on a extraordinary post about BITCOIN TA , wrote by 
I wrote there that I was fully aligned with

The "vision" was, as I wrote, a potential HEAD-AND-SHOULDER patterns almost ready to get triggered.
You have to understand that TA analyst are always searching for this kind of indications in order to take decisions and, if you ever find this sort of pattern it is very likely that the prediction occurs... In this case, that pattern was indicating a sudden drop may happen of at least 400 USD as a minimum target...
Just a one day and a half after, the drop occurred... And so, BTC is now trying to consolidate the price at a lower level...
Today I see exactly the contrary on BITCOIN short term chart...and it is an INVERTED - HEAD & SHOULDER pattern, tiny but it is so...
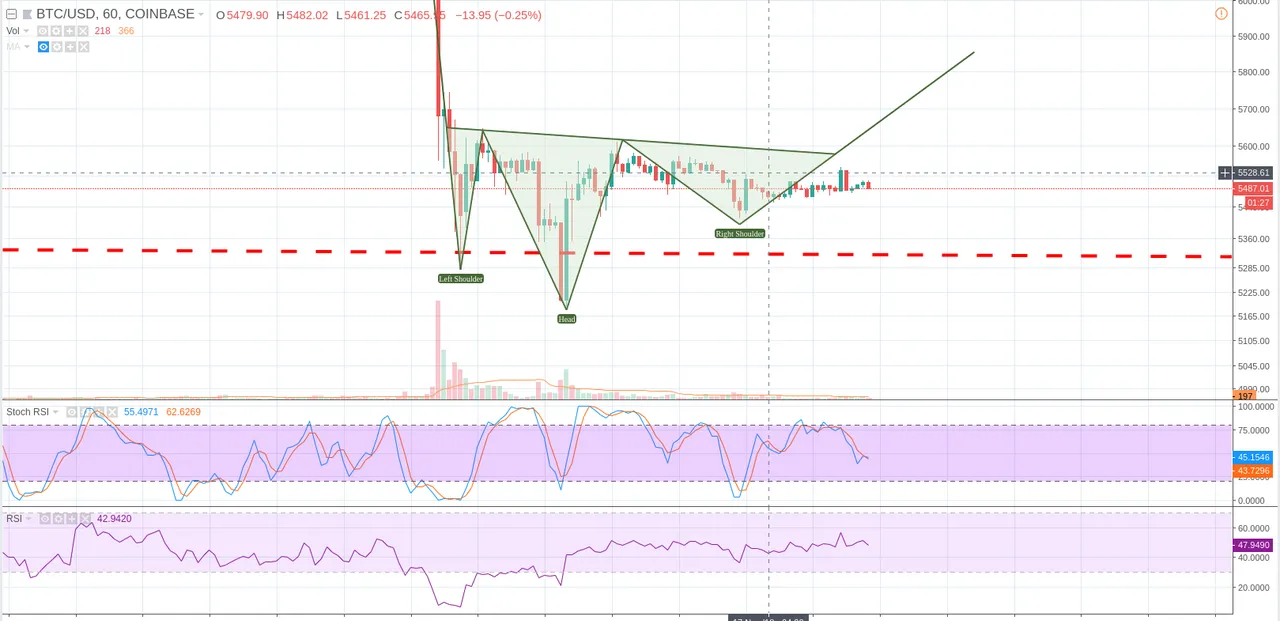
As I said is a "tiny" indication but, if triggered, it may indicate a nice rise up on BTC price...
If BTC price overpasses the "Neckline" currently at 5570USD, price may experiment a move upwards of around 400$, bringing BTC close to the level of 5900USD...
Please, consider this post as a pure educative Technical Analysis content. The situation of the market right now does not give any guarantees of a reversal move, however is always worth to analyze and learn from past experiences and common psychological patterns.
Enjoy.

*Disclaimer: This is just my personal point of view, please, do your own assessment and act consequently.
Neither this post nor myself is responsible of any of your profit/losses obtained as a result of this information.
Published on

by toofasteddie
