Picture 1:
These are bullish counts. Note that bearish count exists too. If you wish to see it, leave a comment below and I will upload within 24 hours.

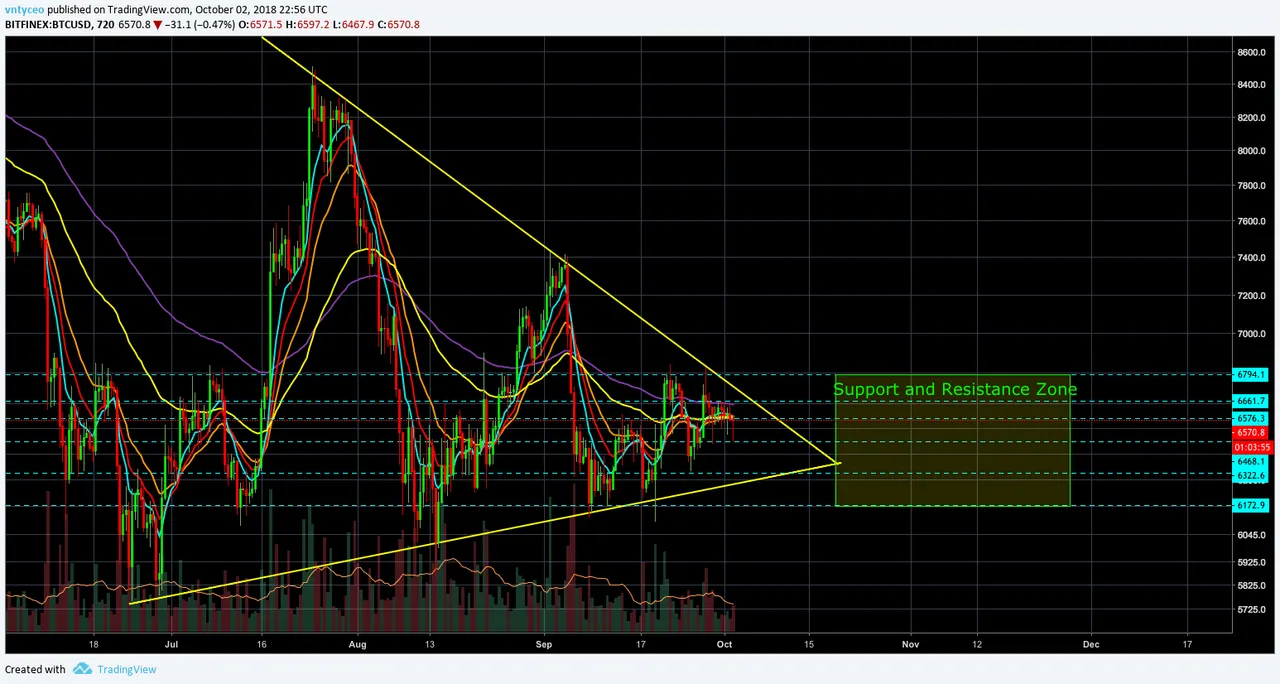
Picture 2:
Here is showing resistance/support lines + trendlines. You do NOT want to trade within 6200~6800 region.
We are currently forming a massive triangle. We can definitely find ascending, descending, symmetrical triangles within this region, which makes it very risky to trade at this very moment.
Picture 3:
These are setups to play with small risk. Everything is based on elliot wave + fibonacci + support/trend line.
Bullish scenario: Buy above $6,800. Target below $7,520. Stop loss below $6,500.
Bearish scenario: Sell below $6,150. Target above $5,550. Stop loss above $6,400.

Your money, your risk. I am only here to help to increase winning probability for you all.