
In this video I go over a very important, and divisive topic in the United States of America, and that is crimes committed by different race groups. There is an overload of random information in the news and online about this topic but often times this information is incomplete, spun in a way for a given agenda, or flat out inaccurate. That is why I decided to make this video.
In the video, I go over the Federal Bureau of Investigation (FBI) arrests data broken down by the reported race of the individual as well as the ethnicity. The race and ethncity groups are shown below:
Race:
- White
- Black or African American
- American Indian and Alaska Native
- Asian
- Native Hawaiian and Other Pacific Islander
Ethnicity:
- Hispanic or Latino
- Not Hispanic or Latino
The definitions of these groups are illustrated in the video, and it is important to note that that the individual's perceived grouping is used in the definition as opposed to a concrete scientific definition.
I take the arrest data and develop a very extensive Microsoft Excel File that graphs and tabulates the arrests as well as the more important, Arrest Rate which is the arrests per 100,000 people. Analyzing the arrest rate is important because the populations of each race and ethnicty group are very different.
From the data, it is clear the arrest rate is the highest for black people, while by far the lowest are Asian people. In terms of ethnicity, results were very similar for both hispanic and non-hispanic people. These results are very interesting and should be used as the basis for looking for possible reasons and solutions to lower overall crime rate.
In the excel file, I also created a Pivot Table and Chart which are very powerful tools in Microsoft Excel to analyze large sets of data quickly and visually so make sure to download my excel file, in the link below, and analyze the data for yourself! Learn more about pivot tables and charts by watching my earlier videos:
- Pivot Tables and Pivot Charts in Microsoft Excel: Introduction:
- Intro to Tables in Excel 2007:


Also in this video, I discuss a bit about the importance of using a logarithmic scale for analyzing data, and I will look to expand on this in later videos.
Also in later videos, I hope to expand the data to include different countries, years, as well as indictments and convictions, to see of any possible trends or issues that need to be addressed. Please let me know what you think of these results by commenting below as it will be help me in later videos on this topic.
Watch on DTube:
Watch on BitChute:
Download PDF Notes: https://1drv.ms/b/s!As32ynv0LoaIhtY1mH9qAQ2cIwFGsg
Download Excel File: https://1drv.ms/x/s!As32ynv0LoaIhtZeSZ7dbT82s9vvZw?e=pkZcTQ
View Video Notes Below!
Download These Notes: Link is in Video Description.
View These Notes as an Article: https://steemit.com/@mes
Subscribe via Email: http://mes.fm/subscribe
Donate! :) https://mes.fm/donateReuse of My Videos:
- Feel free to make use of / re-upload / monetize my videos as long as you provide a link to the original video.
Fight Back Against Censorship:
- Bookmark sites/channels/accounts and check periodically
- Remember to always archive website pages in case they get deleted/changed.
Join my private Discord Chat Room: https://mes.fm/chatroom
Check out my Reddit and Voat Math Forums:
Buy "Where Did The Towers Go?" by Dr. Judy Wood: https://mes.fm/judywoodbook
Watch my #AntiGravity Video Series: https://mes.fm/antigravity-playlist
Follow My #FreeEnergy Video Series: https://mes.fm/freeenergy-playlist
NOTE: If you don't have time to watch this whole video:
- Play this video at a faster speed.
--TOP SECRET LIFE HACK: Your brain gets used to faster speed. (#Try2xSpeed)
--Try 4X+ Speed by Browser Extensions, HookTube.com, Modifying Source Code.
--Browser Extension Recommendation: https://mes.fm/videospeed-extension- Download and Read Notes.
- Read notes on Steemit #GetOnSteem
- Watch the video in parts.
USA FBI Crime Statistics: Race Breakdown: Arrests 2015

I have noticed an overwhelming amount of misinformation on the news and online about crime in the United States, especially in the growing and heated race relations.
The first step to any solution is to look at the facts as plainly as possible.
All statistics in this video are for the year 2015.
I will look to add different years, countries, comparisons, and as well as yearly trends in later videos, depending on the feedback for this video.
Population Breakdown by Race
Sources:
2015 Population Estimate: http://factfinder.census.gov/bkmk/table/1.0/en/PEP/2015/PEPSR6H?slice=Year~est72015
Notes on the Estimates: http://factfinder.census.gov/faces/affhelp/jsf/pages/metadata.xhtml?lang=en&type=program&id=program.en.PEP#
Notes on Race and Ethnicity: http://www.census.gov/topics/population/hispanic-origin/about.html
From the Notes on Race and Ethnicity:
These standards generally reflect a social definition of race and ethnicity recognized in this country, and they do not conform to any biological, anthropological, or genetic criteria.
On Hispanic definition:
OMB [Office of Management and Budget] defines "Hispanic or Latino" as a person of Cuban, Mexican, Puerto Rican, South or Central American, or other Spanish culture or origin regardless of race.
Notes on Race: https://www.census.gov/topics/population/race/about.html
From Notes on Race:
- White – A person having origins in any of the original peoples of Europe, the Middle East, or North Africa.
- Black or African American – A person having origins in any of the Black racial groups of Africa.
- American Indian or Alaska Native – A person having origins in any of the original peoples of North and South America (including Central America) and who maintains tribal affiliation or community attachment.
- Asian – A person having origins in any of the original peoples of the Far East, Southeast Asia, or the Indian subcontinent including, for example, Cambodia, China, India, Japan, Korea, Malaysia, Pakistan, the Philippine Islands, Thailand, and Vietnam.
- Native Hawaiian or Other Pacific Islander – A person having origins in any of the original peoples of Hawaii, Guam, Samoa, or other Pacific Islands.

Population Breakdown by Ethnicity

Arrest Data
Source: https://ucr.fbi.gov/crime-in-the-u.s/2015/crime-in-the-u.s.-2015/tables/table-43/#overview
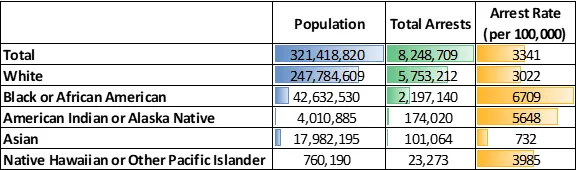
Estimated Population of all locations that provided crime data to the Federal Bureau of Investigation (FBI): 246,920,373
To calculate the Arrest Rate (per 100,000 people), I assumed the race percentage breakdown for the total population is the same for the estimated FBI data population estimate.

**Example: **
White people accounted for 5,753,212 arrests and 77.09% of the population.

Total Arrests by Race

Arrest Rate by Race

Total Arrests and Arrest Rate by Ethnicity
Notes:
• The ethnicity totals are representative of those agencies that provided ethnicity breakdowns.
• Not all agencies provide ethnicity data; therefore, the race and ethnicity totals will not equal.

Date Breakdown by Race


Charts in Log Scales
Sometimes a good way to analyze data is by looking at a logarithmic scale of some of the data.
Basic Idea is to convert the scale to a "power of 10" scale.
I will go over this in detail in another video so stay tuned for that!


Breakdown by Ethnicity


Charts in Log Scale

For further insight into the data, make sure to download my Excel Sheet and play around with the Pivot Chart and Table!
Summary of Results
• The larger population correlates to more arrests for all races except Asians.
• Asians have nearly an order of magnitude lower arrest rate than all the other races.
• White people have an arrest rate slightly lower than the average.
• Black people have significantly higher arrest rate than all the races, followed closely by Native Americans, then by Hawaiian Natives.
• Hispanic vs. non-Hispanic arrest rates are very similar.
Note that these results are only for Total Arrests.
For specific arrest categories, I may look into those in more detail in further videos.
Further Notes:
The data shown in this video are only for arrests, so further analysis is required for indictment and convictions.
This data is meant to lay the ground work for proper and fact based discussion on crime and the justice system of the USA, as well as creating a template to analyze different countries later on.
Some possible reasons for differences in crime rate by race may include financial and cultural differences, and all avenues for solutions to lower overall crime rate should be considered, but again in a fact-based methodology.