I've been trading full-time for almost 10 years now.
A friend of mine introduced me to cryptocurrencies earlier this year. I mainly trade US stocks based both on technicals (charts) and fundamentals (earnings growth, sales growth, ...).
When I first started trading, I was all over the place. I didn't have any defined strategy, just seeing chart patterns where there wasn't any. Needless to say that I lost money consistently for a couple of years in a row.
It's only when I focused on only one particular setup, becoming an expert at that particular setup, that my trading finally turned around. This setup can be seen in any type of market. The crypto world is no different.
THE SETUP: THE BASE BREAKOUT
You'll see on the Internet many trading "gurus" wannabes sharing charts with many fancy lines and indicators.
Let me tell you that in trading, complexity is the enemy of consistent returns.
There are only 4 elements you need to know:
1- Price
I use basic OHLC bar charts. Candlestick charts with their fancy patterns are just not necessary for this trading setup.
O stands for Open price
H stands for High price
L stands for Low price
C stands for Close price
So for each bar, you know exactly at what price did the bar opened, what is the highest price that was reached, the lowest price, and the price at which the bar closed.

2- Volume
The volume shows how many shares got exchange for duration of one particular bar.
This is a very important information that shows people's appetite for a stock or in our case, a cryptocurrency.

3- Base
A base is also called a consolidation.
Nothing moves straight up or straight down in the markets. Every moves requires some period of consolidations where price is not moving much, as buying pressure and selling pressure come to a certain equilibrium.
Although consolidations come in many forms, the only one we are interested in are horizontal consolidations, where the prices are stuck within a more or less small range.
Typically, we like to see volume drying up on the right side of the base. It shows there is less and less people interested in buying and selling.

4- Base breakout
A base breakout is when the price breaks above (or below) the price range of the base.
In this example, a base was formed where the price did not move much for quite a while, oscillating between 600 ad 618.
Then finally the price pierced through that 618 level, and the price continued higher eventually, after that base breakout.
Note the huge volume as the price broke above the base. That definitely showed a lot of interest, a lot of buying pressure coming in.

So that basically is the setup. Pretty straight forward isn't it?
Look and wait patiently for a period of consolidation where the price forms a base. Then buy when the price breaks above the base on unusually high volume.
But why do we have to wait for the breakout before getting in?
Simply because there is no way to know in advance when and whether the price will break to the upside, or the downside.
Here is an example of a base breakout that resulted in the price going much lower:

EXAMPLES OF POWERFUL BASE BREAKOUTS
You can find this setup again and again, in any stock, any cryptocurrency, right before huge moves.
Here are a couple of example so you can better train your eyes to spot them. For each of them, take the time to notice the base, and then the breakout on large volume.
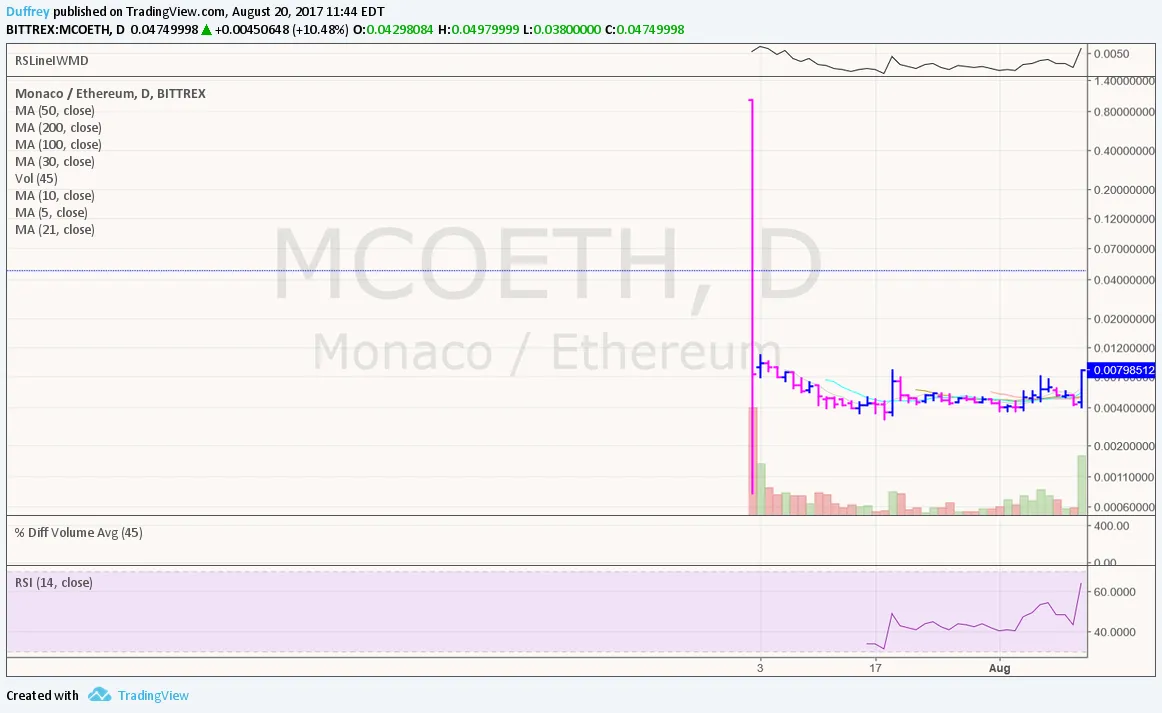
Monaco
1- On base breakout
2- After the base breakout

OmiseGo
1- On base breakout
2- After the base breakout


Neo
1- On base breakout
2- After the base breakout


Bitcoin Cash
1- On base breakout
2- After the base breakout


Dash
1- On base breakout
2- After the base breakout


WHY DOES THE BASE BREAKOUT WORK?
It's basically buying and selling pressure that moves the prices up and down.
When a base is formed, there is some kind of an equilibrium between buying and selling pressure.
As the base formation progresses, people who want to sell already sold, and people who wanted to buy already bought.
What happens on breakout is a sudden shift between buying and selling pressure. The selling pressure is completely overwhelmed by a strong buying pressure, often caused by a positive news nobody knew about.
Note that with that setup, you don't even need to spend your time scouring the Internet for news. You don't need to know what the big news is or when it will get out. You can see right away that something big is happening and you can be among the first ones to get on board, right at the beginning of a potential very large move.
Then as the breakout occurs, since most people who wanted to sell before already sold, most people are at a profit and there is even less reason to sell. Furthermore, the price action causes FOMO (Fear Of Missing Out) within the community, and additional buying pressure comes in, adding fuel to the fire.
COUPLE OF POINTERS
- The longer the base, the most powerful is the move. The best bases are visible on daily and even sometimes weekly charts.
- If the volume on breakout is not much bigger than usual volume, the breakout is suspect
- The tighter the base (price range) the better
- The volume drying up on the right side of the base is much better
Hope it was informative.
Also note that I haven't talked yet about when exactly to enter, what position size should you use, when to sell when at a loss, and when to sell when at a profit.
I'll share more posts on my experience as a full-time trader in the days/weeks to come.
Happy Trading!