The market has already lost over a total of over 34 billion dollars since June of this year. To understand what is happening, I believe the best way is to go back in time and learn about history.
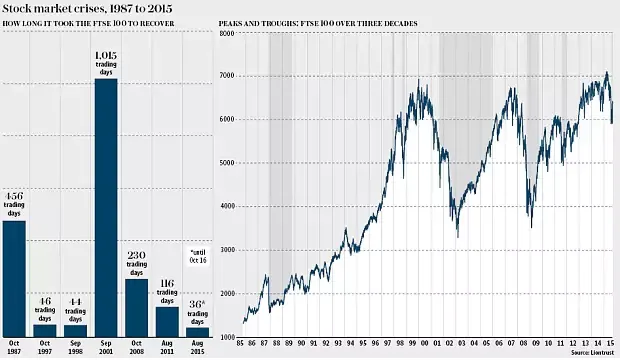
This is the stock market from 1987 to 2015. The data is organized by LionTrust, a fund manager . The chart shows you what the stock market look like throughout the last 30 years and how many trading days was needed for the market to recover after each crash.
Here is a list of market setbacks shown on the graph:
Program trade crash - 1987
Asian crisis - 1997
Russian crisis - 1998
Tech Bubble - 2000
Global financial crisis - 2008
Greek debt crisis - 2011
China’s “Black Monday” - 2015
Tech Bubble
The one that I'm going to mention is the Tech Bubble. To make sure that we are all on the same page, here is a quick definition of what a bubble is. A bubble takes place when market participants drive the prices of the market above their actual value.
The Tech bubble, also known as the dot-com bubble, occurred around the year 2000. Around that time, there was a huge amount of interest in internet-usage. Investors were eager to invest in anything internet related with a “.com” suffice in its name. Large amount of money were thrown into it, which drove the stock prices up tremendously.
Many of the personal investing occurred during the boom. The amount of technology companies rose from 1,000 in 1995 to 5000 by the year 2000. At the height of the boom, many dot-com companies became public companies through the initial public offering, also known as the IPO. Many investors were grabbing every new issues they can. In 1999, there were 457 IPOs, in which 117 doubled in price on its first day of trading. The IPOs allowed the companies to raise a substantial large amount of money before they have ever made profit or realize any material revenue. (Does this ring a bell for anyone? This sounds similar to all the ICOs that’s been coming out.)
Bitcoin bubble in 2013
At the start of 2013, the price of bitcoin was around $12. It then soared to $1,242 per bitcoin, resulting in a 10,250% gain. However, after hitting the year’s high, the price dropped $28% in less than two weeks hovering around $961 per bitcoin. It then continues to gradually decrease in price until it was around $250.
Comparing google trends and price of bitcoin

The first chart shows the price of bitcoin through its lifetime and the chart beneath it is the amount of bitcoin interest via google search. Take a good look at it, I labeled the events that occurred throughout the years and you should also be able to see the correlation between the two charts.

This last chart is the total market capitalization. Just another visual to show the correlations between google search trends and the cryptocurrency market cap.
From what I see, whenever there is a huge increase in price, interests generates quickly from all over the world. This is expected since people are drawn to where the money is. However, whenever the market is driven by too much greed, it is only a matter of time before the market comes crashing down. People are just throwing in money trying to catch the train, this is very unhealthy and is a huge warning sign. Looking at the dot-com bubble of 2000 and past bitcoin bubbles, history is telling us that we are very likely in another bubble.
Source:
http://www.telegraph.co.uk/finance/personalfinance/investing/shares/11931489/Thirty-years-of-stock-market-crashes-and-the-signs-they-were-coming.html
https://www.forbes.com/sites/kitconews/2013/12/10/2013-year-of-the-bitcoin/#7d7cfafd303c
http://www.investopedia.com/features/crashes/crashes8.asp
https://en.wikipedia.org/wiki/Dot-com_bubble
https://coinmarketcap.com/charts/
http://www.coindesk.com/price/
https://trends.google.com/trends/explore?date=all&q=bitcoin