
This morning in my trading group errone was saying how shit EOS looked and how it didn't look like a buy. As I was currently long (ie bought with leverage), I thought I'd take a look at the chart and was surprised to see one of the best looking short term set ups I'd seen in a while:
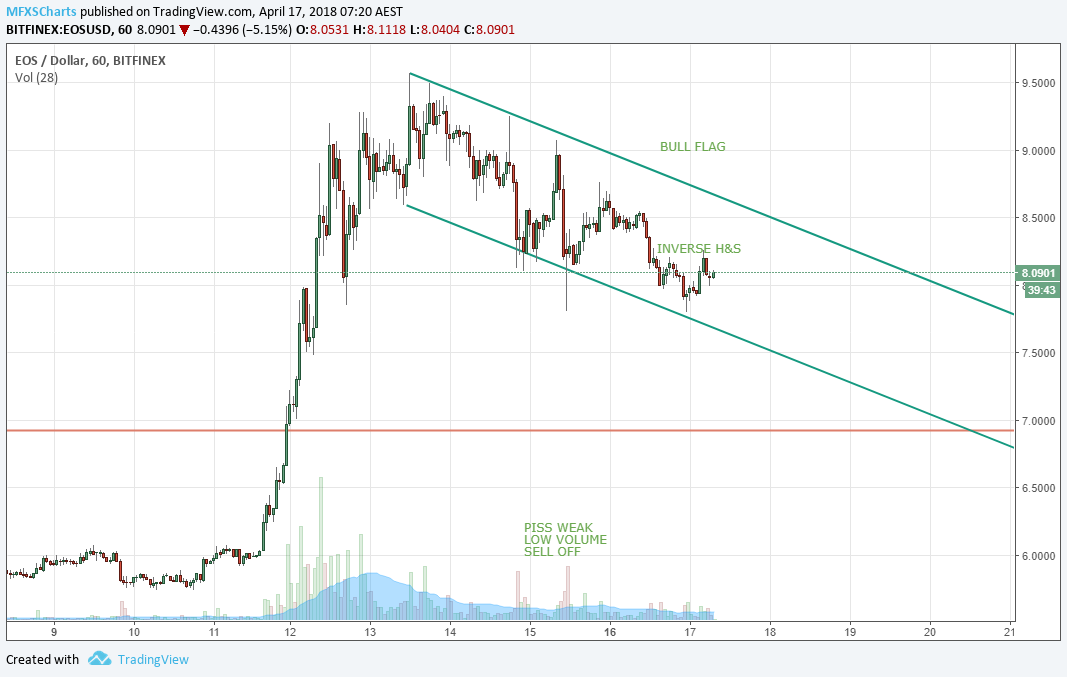
Healthy sell off following the eosDAC snapshot - volume totally suspect, Bull Flag and little Inverse H&S at flag support. What's not to love? Let's fast forward a few hours and see how this near perfect structure played out:
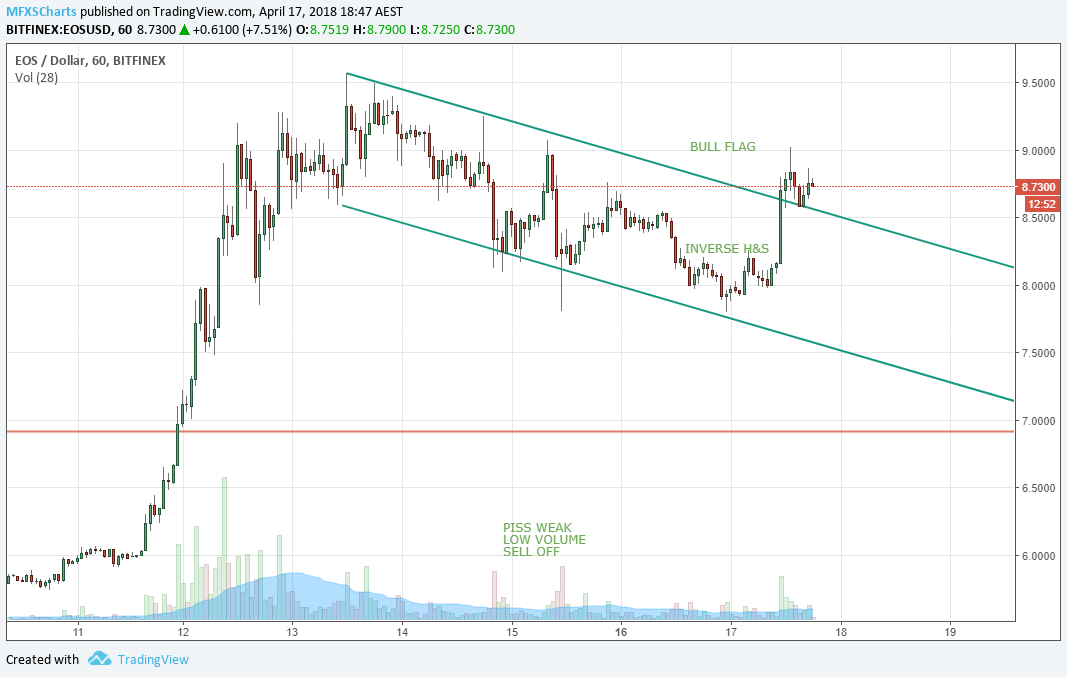
Wham, bam, thank you @Dan - I'll be back for some green eggs n ham.