Crypto has seen a lot of volatility in the past week. Prices are dropping to levels that a lot of people were not expecting. Even the old school crypto heads.
A 20%, 30% corrections during a bull market has been seen before and its nothing unusual. But this correction has been bigger that that and it put in an uncertain position a lot of traders.
Unlike the previous cycles, this time around we have DEXs and DeFi and yield farming. A much more trading activity is now happening on chain. The top DEXs are on Ethereum, an as always during a volatile period, transactions and volume usually goes up.
Let’s take a look at the data on the Ethereum network and see what has been happening in the last period.

The data presented here is mainly from etherscan charts and some Glassnode charts as well.
We will be looking at:
- Number of Addresses
- Active Addresses
- Hash Rate
- Daily Transactions
- Fees
The period that we are looking into is from 2015 – 2021, with a close lookup on the last months April and May.
Number Of Addresses
One of the key metrics for crypto projects is the number of wallets.
First the overall number of wallets.
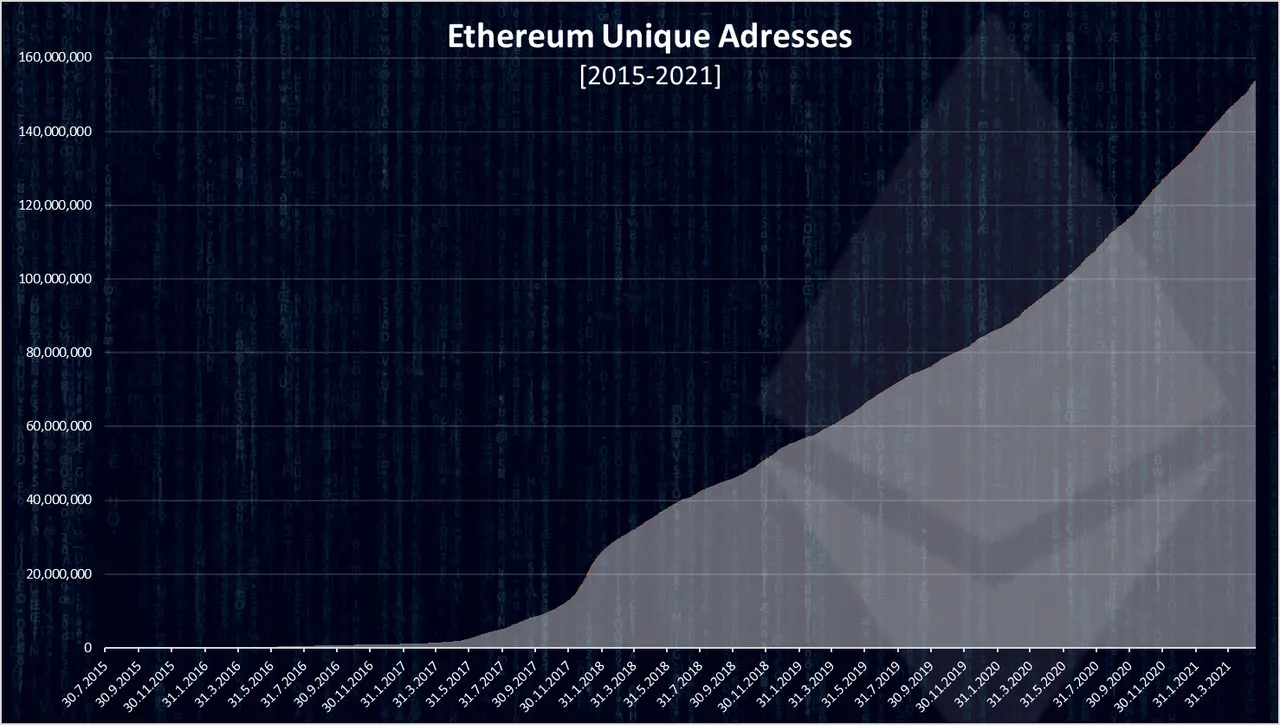
The number of ETH wallets addresses has been growing at a fast rate and now it is around 154M. It is the crypto with the highest number of wallets. For comparison Bitcoin has around 60M wallets at the moment.
If we zoom in in the last two months we get this.

This is the chart for the number of new Ethereum wallets created daily. We can see that there is a pick around May 11, with 280k wallets created per day and then a decline to 150k.
This chart is following the price. As the price goes down so the numbers of new daily wallets.
Active Addresses
What’s more interesting in times like this is how many wallets are transacting. Volatility should increase the numbers of active wallets. How many of those 154M addresses are actually active?

The previous ATH for active daily wallets was in January 2018 with around 700k active wallets per day. On May 9, 2021 a new ATH in terms of active wallets was reached with 800k active wallets per day.
If we zoom in we get this.

As already mentioned, the ATH was on May 9, 2021. We can see a steady increase in the number of active wallets till May 9th and then a drop afterwards. The activity is following the prices here as well.
Daily Transactions
The activity on the network is mostly represented by the number of daily transactions.

A new ATH in transactions was reached in the last period as well.
Here is the close up.

A very similar trend as for the number of wallets. An increase up to May 10th and then a slow decline. On May 10, 2021 there was 1.7M transactions per day.
#ETH Fees
The very unpopular topic, the ETH fees 😊. Here is the chart.

On the overall timeline we can just notice the recent increase in the fees and the small bump in 2017.
The data for the last months looks like this.

The average ETH fees per transaction in terms of USD have been more than 20$ in the period above.
The record high was on May 11 wit 68$ average daily fees. Then we had a spike on May 19 as well with more than 50$ average fees on that day. May 19 have seen a big correction.
As mentioned, the above are average fees. An Uniswap trade is a smart contract transaction and those are more expensive than a regular transaction. Users reported fees in the hundreds, even a thousand fee in the last days. This happened in the peak hours during the crash. At least Uniswap kept working during the price crash unlike most of the centralized exchanges that stopped deposits and withdrawals during the peak time.
Hash Rate
The network security in a proof of work chain is measured in hash rate, or how difficult is to mine. The bigger the completion, the higher the hash rate.

The ETH hash rate has been growing and it has reached a new ATH crossing the 640k GH/s. The Ethereum network now has more miners than ever before.
Overall, the Ethereum network metrics are following the price movement with more wallets created when the price is going up and less when it’s going down. The number of active daily wallets has reached a new ATH with 800k active wallets per day.
The number of transactions has also gone up, but with a similar pattern as wallets it is following the price movement.
The fees unfortunately have also gone up. The Hash rate (mining power) keeps increasing.
In terms of the price correction, it seems to caused decline in the number of active wallets and transactions. Only the fees have went up, but only in one day and for a short period of time.
I was expecting a bit more increase in transactions and active wallets but this seems to be not the case. On the other hand, the trading volume is at record high, both on DEXs and CEXs. This shows that a minority of the wallets are trading and playing on the market. For the general public this is not the case. It also shows that the trading volume is in a minority of the wallets.
