This article analyses the price of ethereum token and hive within the stated period above. It aids future reference. Someone might be interested in the price of hive or ethereum in the nearest future and may want to make reference to this content.
This content plays a major important role in record keeping and reference purposes.
In the course of this analysis, I shall be using SPSS software. SPSS stands for statistical package for the social sciences.
In this study I shall consider the following objectives.
Mean Price of Ethereum and Date
Mean Price of Hive And Date
Maximum and Minimum Price of both Asset
Correlation Analysis
Conclusion
Mean Price of Ethereum and Date
The image below shows the mean graph plot of ethereum price with date.

It can be seen in the last few days between July 20-25, 2022, there was a bull in the price of ethereum above $1500.
Mean Price of Hive And Date
The image below shows the mean graph plot of hive price with date.
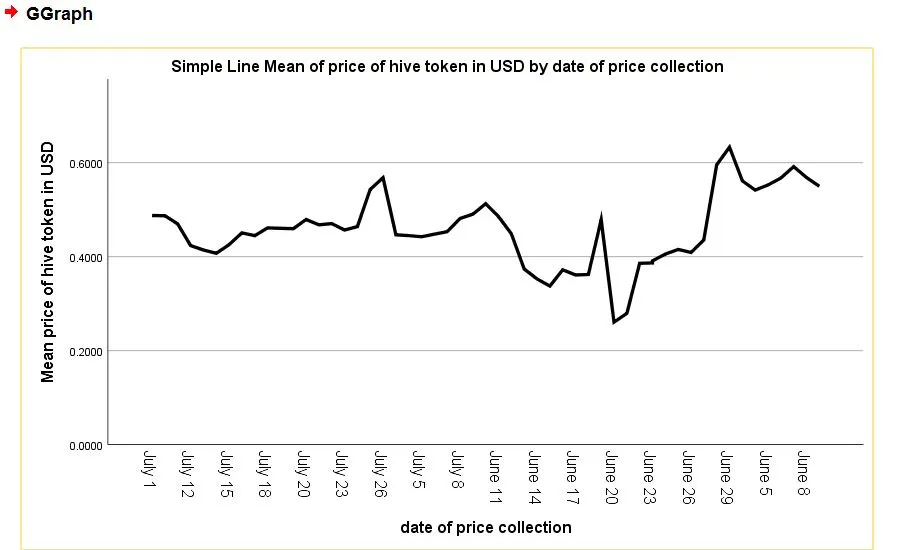
It can be seen that from the period of June 29, 2022, the price of hive rose above $0.6. There has also been a significant improvement in hive abobe $0.5 in July 25 – 26, 2022.
Maximum and Minimum Price of both Asset
The maximum and minimum price of both asset can be seen in the image below.

Ethereum
Maximum - $1906.52
Minimum -$940.19
Hive
Maximum - $0.6778
Minimum -$0.0371
Correlation Analysis
From the analysis of relationship, there seem to be a positive relationship between both tokens (hive and ethereum). With a coefficient of $0.483. shows a medium positive relationship. This means that as ethereum price climbs, the price of hive will climb on an average rate.

Conclusion
This article has been able to analyze the relationship and price feature of ethereum and hive token.
Other images attached are
Data view mode

Variable view mode

Price of eth and hive

Thanks for reading.