
When I started my trading journey, I started off just like most and floundering around trying to learn different indicators and which one was going to tell me the future, only to end up clogging up my screen with too many of them that I end up getting analysis paralysis.
I have always been interested in the inner workings of these indicators and how they work, which led me down the road of learning the Pinescript language. With the insurgence of AI, namely ChatGPT, I felt comfortable in beginning my PS development journey with a little assistance. But AI doesn't always get it right, you will have to learn how the stuff works. So it's been a fun and interesting journey going through TradingView indicators, learning how they are built, as well as Pinescript documents to build the most effective indicator I possibly can.
The result...
The Logical Trading Indicator

This indicator uses a combination of different filters to give you effective BUY and SELL signals that you can use in a mechanical way to gain an edge in trading the markets.
Bollinger Bands
The first part of the indicator, and the main part is the custom built Bollinger Band. The basis line, which is a moving average that is adjustable in the settings and is the basis for the entire indicator. The moving average settings gives you the ability to not only change the time length, but also the type of moving average. So you have the choice of a simple or exponential moving average.
This moving average changes color based on the price being above or below the line. This is also one of the filters for the BUY and SELL signals.
The bands you see give a zone, or range, and the standard deviation is adjustable in the settings to get the best out of the indicator. These bands are what fires the longTakeProfit and the shortTakeProfit signals and also helps give an indication of volatility and momentum in the markets.
Average True Range or ATR
They BUY and SELL signals are not only based on the Bollinger Band, but also the ATR or Average True Range indicator. Unlike other indicators that solely rely on closing prices, ATR focuses on the range between high and low prices. It takes into account any gaps between successive trading sessions.
ATR is calculated by taking the average of the true ranges over a specified number of periods. The true range is the largest of the following three values:
- The difference between the current high and the current low.
- The absolute value of the difference between the current high and the previous close.
- The absolute value of the difference between the current low and the previous close.
ATR's Role in the Logical Trading Indicator
In the Logical Trading Indicator, the ATR is employed primarily for two purposes:
Sensitivity of Alerts
ATR is used to determine the sensitivity of alerts, which influences the width of stop-loss values. A higher ATR value results in tighter stop-loss values, while a lower ATR value leads to wider stop-loss values. This means that during periods of higher volatility, the indicator becomes more responsive to price movements, providing traders with timely alerts.
Trailing Stop-Loss
ATR is utilized to calculate a trailing stop-loss value that helps traders manage their positions. The trailing stop-loss dynamically adjusts as market conditions change. During periods of high volatility, the stop-loss value widens to account for larger price fluctuations, and during lower volatility, the stop-loss tightens to protect gains.
The formula for calculating ATR involves finding the average of the true ranges over a specified number of periods. The ATR Period input in the indicator determines the number of periods used for this calculation. A higher ATR Period leads to a smoother ATR line but may respond more slowly to recent price changes, while a lower value makes the ATR line more sensitive to recent price changes.
Additionally, the Key ATR Multiple input influences the overall impact of ATR on the indicator's behavior. This multiple scales the ATR value and affects the sensitivity of alerts and the width of trailing stop-loss values. The way it works is taking the ATR and multiplying it by the Key Multiple and that is what gives you the trailing stop values.
Squeeze Indicator

The Squeeze Indicator reflects periods of consolidation—when volatility retreats and prices consolidate, resembling a coiled spring waiting to release. In these moments, the Squeeze Indicator showcases its power, signaling the potential for explosive price movements.
How it works
The Squeeze Indicator achieves its insights by combining two vital elements: Bollinger Bands and the Keltner Channel. These components intertwine to create a tapestry that encapsulates market sentiment.
Bollinger Bands
Most of you know the Bollinger band, as it is the main part of the indicator, but just a reminder, these bands envelop price action with an upper and lower boundary. During a squeeze, these bands contract, capturing the market's stillness. The indicator watches for the narrowing of these bands, marking a period of potential compression.
Keltner Channel
This channel, like a sentinel, traces the average true range of prices. It too tightens during a squeeze, mirroring the market's subdued volatility.
When these two indicators align—when both the Bollinger Bands and the Keltner Channel narrow—the Squeeze Indicator paints a a picture with a series of markers.
The Squeeze Indicator shows its insights through series of shapes on the bottom of the chart. A white circle emerges, symbolizing the squeeze, the quiet before a potential storm. It's a reminder that behind the silence, market forces are building energy, preparing for a move.
When the squeeze releases, the chart changes. A green arrow signifies a bullish release, signaling a potential upward surge. A red arrow denotes a bearish release, hinting at an impending downturn. These arrows symbolize the market's return to motion, a reminder that volatility has rekindled.
Bar Colors
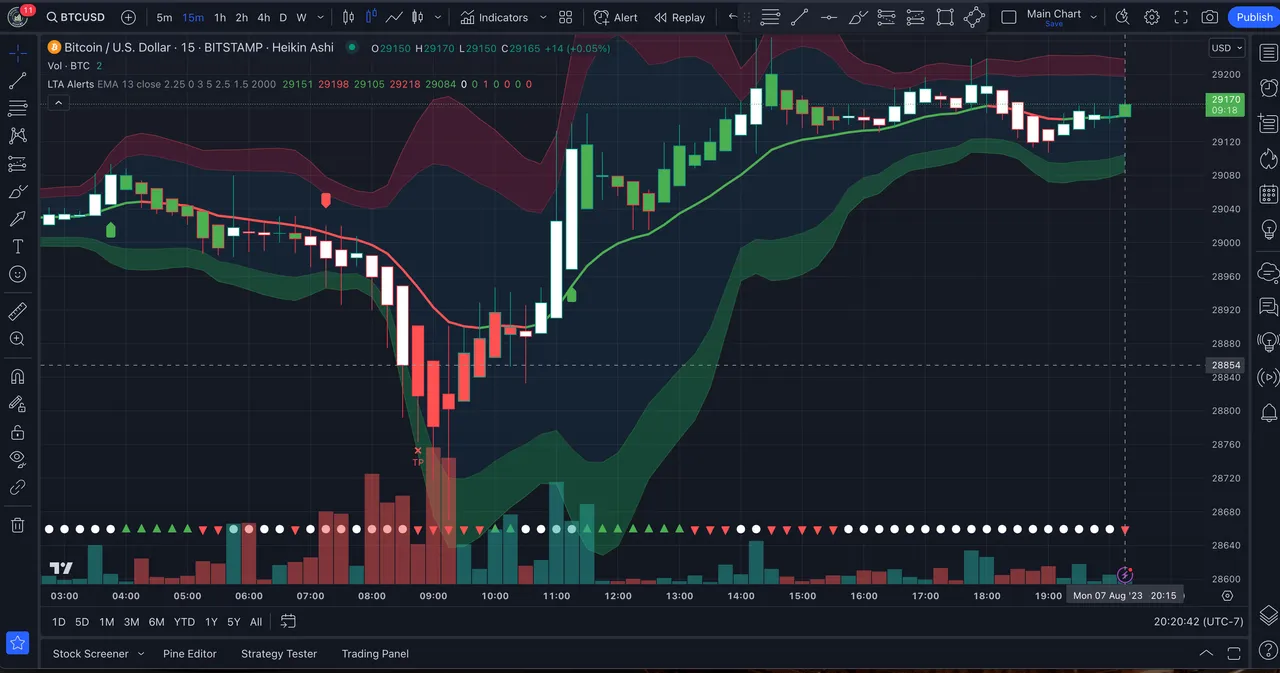
I have also included a bar color function that gives you another way to view the market. When this part of the indicator is turned on, the candlesticks will change colors. Instead of the standard red and green for each candle, the colors change to reflect the state of the market.
When the indicator is flashing a BUY signal, the candle bars turn green to reflect the state of the signal. This can help you stay in a trade until the trend changes.
When the indicator is in a SELL signal, the color bars will change to red, indicating the bears are in control.
And last but not least, when consolidation is in place and a squeeze is on, the candle bars will turn white. This can help you also visually filter your trades based on the volatility of the market and help you stay out of low volume moves.
This part of the indicator is on by default, but can be toggled in the settings.
BUY and SELL Signals and how they work
BUY Signals
When the stars align and conditions are ripe for a bullish uprising, the indicator flashes a "Buy" signal. This signal signifies that the time is right to open a long position or to close a short one. But how does the indicator determine this auspicious juncture?
Here's the breakdown:
ATR-Based
The Average True Range (ATR) flexes its muscles here. It factors in market volatility to figure out how sensitive your trading approach should be. The higher the ATR value, the more responsive the indicator becomes to price movements.
Basis Crossover
The indicator also examines a crossover between the basis line and the trailing stop-loss value. When these market stars align, it's time to get bullish and give the market the horns.
Squeeze Filter (Optional)
If enabled, the indicator applies a "Squeeze Filter" to ensure that buy signals steer clear of market consolidation periods. This filter adds an extra layer of caution, safeguarding you from false signals.
The culmination of these factors prompts the indicator to signal "Buy." This signifies a moment to embrace the bullish winds, to capitalize on a potential uptrend, and to set sail on the trading voyage.
SELL Signals
When the tides shift in the bearish direction, the indicator delivers a "Sell" signal. This signal shows as a red flag, hinting that it's time to say goodbye to your long positions or to open your shorts, I mean short positions, get your head out of the gutter.
Here is how the Sell signals work:
ATR Based
Once again, the Average True Range (ATR) emerges as a pivotal player. It recalibrates its sensitivity to volatility, guiding you though the market storms giving you the ability to sail to profits.
Crossing Under The Basis
A crossover beneath the basis line and the trailing stop-loss value is examined closely. This boundary-crossing marks the potential for a price decline and is one of the mandatory filters for a signal.
The Squeeze Filter (optional)
Just as with the "Buy" signals, the "Squeeze Filter" keeps you grounded during market consolidations. This filter acts as a shield against deceptive signals that may arise when the market is stagnant.
The convergence of these criteria triggers the "Sell" signal, urging caution in times of impending decline. It's a moment to consider closing out long positions or unveiling the potential of short trades.
Take Profit Signals
Along with the BUY and SELL Signals, I have incorporated a long and short take profit indicator. This indicator helps you in indicating a good place to take some profits off the table.
This signal will fire only once per BUY or SELL signal. For a BUY signal, the take profit marker will show as an X over the bar with a 'TP' above it and both will be colored green. It fires when the price climbs and closes at least one candle inside the upper band zone and then crosses back under and closes. This indicates a possible top of the move and makes a great place to take some of your position off the table, or the entire position if you wish.

The same works with the SELL signal. Once the signal fires, the price needs to drop and close one candle into the lower band zone then climb back above the zone and close above it. This shows the market is likely oversold and is a great place to pocket some earnings.

These signals do not encompass the entire move in many cases, so that's why I suggest taking about 50% of you position and then hold the rest until the next basis cross over or until the next BUY or SELL signal. So to get the most out of the move, you have to learn to ride the current waves of the market. You won't always hit the tops and bottoms, that's why it's best practice to try and make your money in the middle. Maybe these signals will help you catch the bulk of the move.
Alert Conditions
The last part I want to talk about are the different alert conditions I have programmed to help you on your journey. You can set alerts to fire and notify you when a buy or sell signal fires, when the price crosses above or below the basis line, whether a price squeeze is on or off, and if a take profit market fires!
These alerts can be used to help you trade the markets and still live your life. You can sit down for your morning analysis, set alerts to notify you when it's time to trade, and then go about your day. When the signals fire, that will let you know to get to your computer or get your phone out and make some money!
Pre-Release Hive NFTs Coming Soon
I will be minting 100 editions of this indicator on 
Once these are sold out, I will be then minting the indicator on Opensea via Polygon and will be using the unlockable text to then give access to the indicator. The linked document will be a living document and will be updated as I make edits to the indicator.
I will be using this as a fundraiser to help me with my cross country move back to my family farm in the southeastern US and to help me with bills while I get there and get settled.
I will also be giving away a few NFTs in an engagement contest that I am trying to come up with currently. I want to use this contest to help build engagement and followers for my Hive account so I can reach as many people as possible.
So to close it out, I am very excited to reveal this new indicator that I have been putting a lot of hard work into to help me establish the Logical Trading Academy brand!
I will most likely run the official release along with my very first trading book, 'Anyone Can Be A Trader'!
Make sure you are following me for all my awesome updates, trading education, and technical analysis!
Wanna get on a path to financial freedom?
Join the Logical Trading Academy!
https://logicaltrading.academy
Trading Education | Trade Community | Trade Alerts | Market Analysis
Disclaimer: The information in this trade journal is for educational purposes only and should not be considered financial advice. Please consult with a qualified financial advisor before making any investment decisions.
