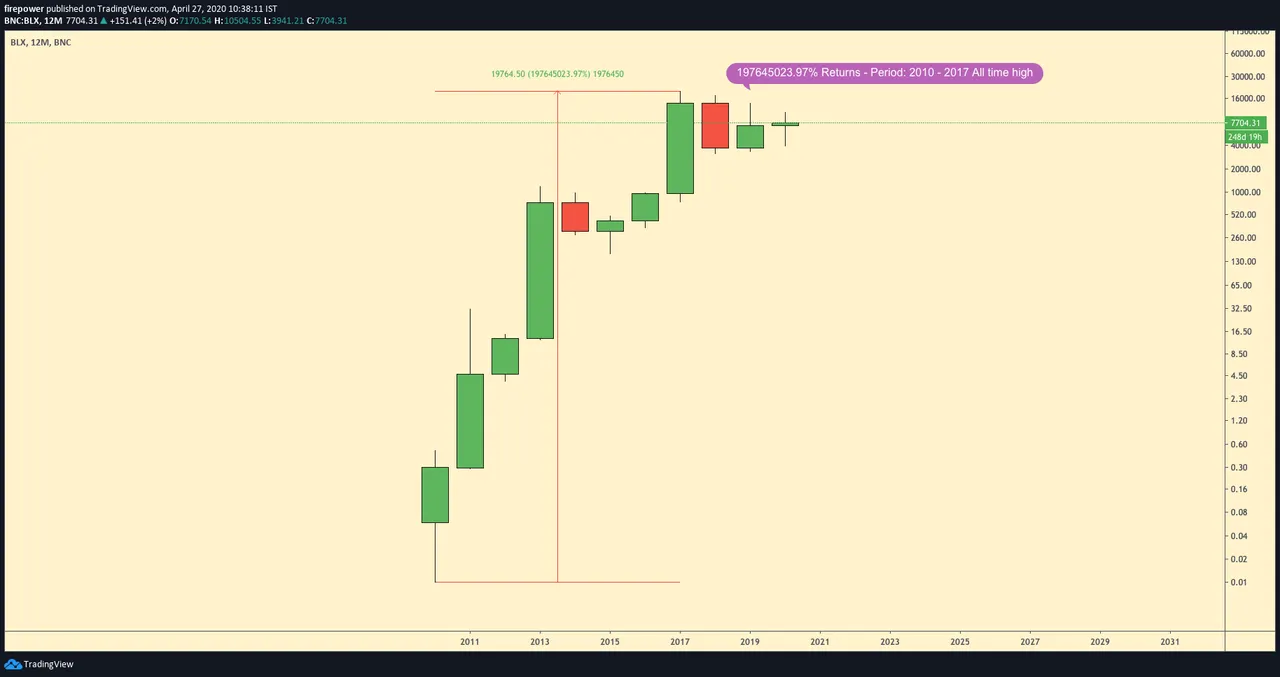
This is the yearly chart of Bitcoin's price action on a logarithmic scale from 2010-2020! Quite insane especially if you consider the absolute ROI across this timeframe.

But this chart has data from 1 cent onwards only and earliest prices were likely to be under this figure. Also, let's not forget the epic moment when 2 Pizzas were bought with 10,000 BTC.
Only 15 days to go until the next miner block reward halving (3rd) event. Previous one was in 2016. You can follow the countdown timer on the 

No matter what our reasons are for being in the crypto space today, we cannot ignore the speculation if we want to sustain in this space for the long run.
It will be interesting to say the least where Bitcoin goes from here and if history will repeat itself from now until the next halving in 2024?

Can you spot the bear market on the chart? This is a linear scale version of the same which will show you the recent bear market. Even then you can barely see the previous bull bear markets compared to the 2017-2020 period.
Insane volatility, random pumps and dumps are commonplace in crypto. A moderate 5x pump for BTC from current prices alone will get us to 35K per BTC.
That's not a bad price even if we get there sometime in 2021 or even 2022. There's always a 50% chance it won't happen, but that's good enough right?
A higher price is certainly welcome, as it's likely to lift up the altcoin markets as well which will benefit all of us. But, I hope HIVE price doesn't correlate itself closely with Bitcoin so that it can continue to move a little freely irrespective of what BTC is doing.
We're off to a good start at the moment and I think there's a lot more action in store for 2020.
Meanwhile, what are your expectations for Bitcoin price action and what do you think about its 10 year price?
If you like my post please rehive and you can also show support by voting my Hive witness node.