In the last post we talked about dynamics of SP/STEEM price and APR for steem power leases on 
First graph shows the dynamics of APR for deals in the last 28 days (the window that is observable in the data for 4w leases).
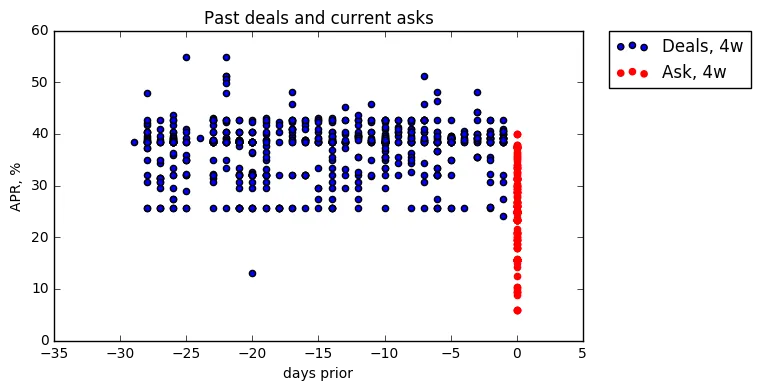
Immediately we can see that the market frontier is consistently located at about 37 % APR. Most of the deals in the last month have closed above this value. Small portion of deals have closed below 37 % APR and almost no deals have APR below 25 %. The reasonable conclusion to make here is that it has no sense to submit a lease request with APR below 25 %. Yet we still see a significant tail of such requests in data.
To refine our result even more I also created a graph for small lots of 200 SP or less. Similar frontier of 37 % APR holds here but the boundary is less evident. Notice also how the lowest reasonable APR forms a line of dots at the bottom of the graph. My guess that it comes from the default value of 150 SP/STEEM in the lease request form. More interesting fact is that these requests are getting filled from time to time.

To summarize what we've seen so far I can say that if you want your order to get filled quick you should consider APR 37 % or higher. If you have some time to spare and do not mind to send your order in several times after rejection - you can try to gamble and submit orders below 37 % APR at around 32 %. But you definitely should not go lower than 25 % as the probability of being filled drops effectively to zero.
Let me know if you want to see this data at another angle. Probably you have a better idea on what to look for than I do.