
SUMMARY
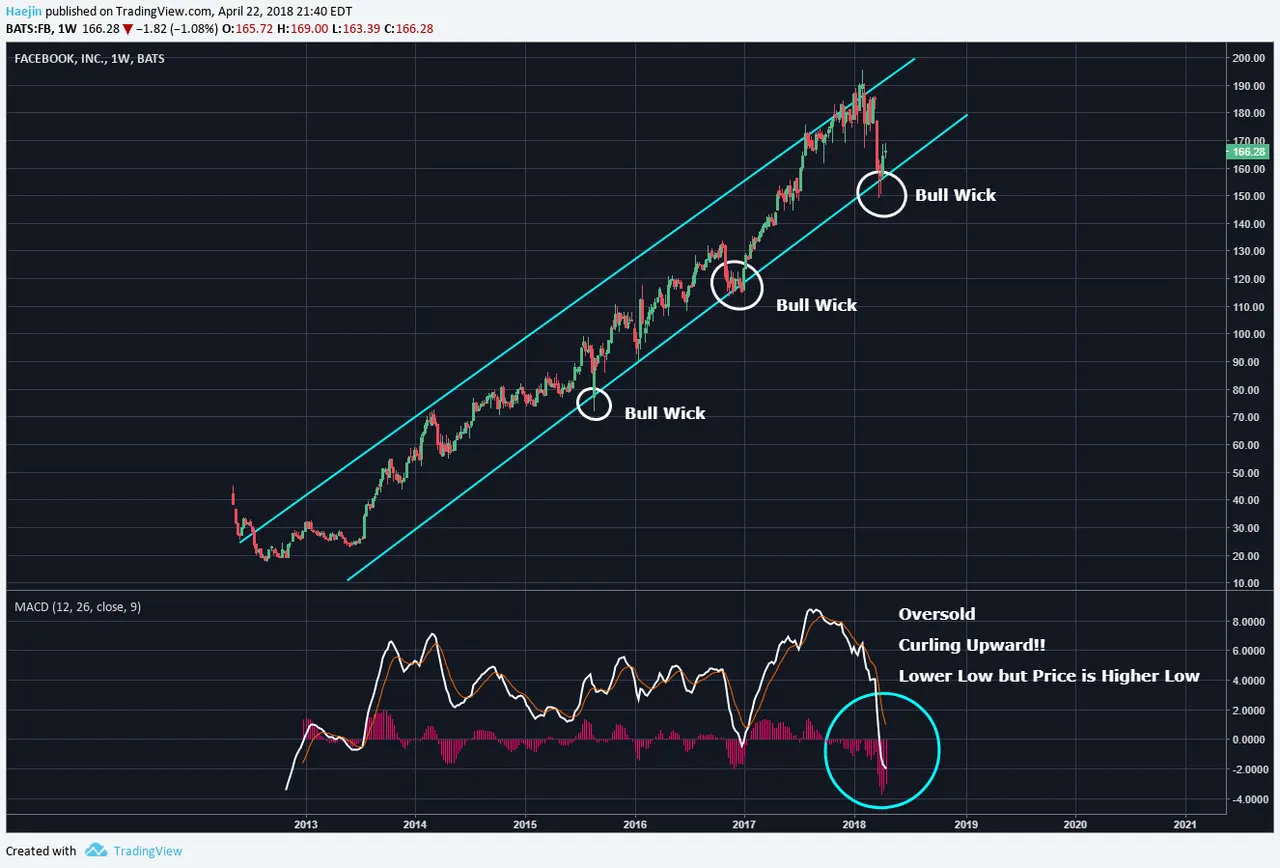
Back on April 22nd, the below bullish chart of FB was posted. It showed how price was likely to rise towards the upper blue trendline.
Back on July 8th, the below chart was posted on Facebook. Price had touched the upper blue trendline and the new projection was a dowturn as shown by the blue arrow.

Once five waves are complete, there is no way of avoiding the requisite correction. The ABC shows that the $110 could be the affinity point for the C wave.

Legal Disclaimer: I am not a financial advisor nor is any content in this article presented as financial advice. The information provided in this blog post and any other posts that I make and any accompanying material is for informational purposes only. It should not be considered financial or investment advice of any kind. One should consult with a financial or investment professional to determine what may be best for your individual needs. Plain English: This is only my opinion, make of it what you wish. What does this mean? It means it's not advice nor recommendation to either buy or sell anything! It's only meant for use as informative or entertainment purposes.