
SUMMARY
Even the ArchAngel's couldn't fly so vertical as had NXT in its impulse of five waves up. The chart shows NXT (NXT/USD) with a mighty extended 5th wave. The subsequent decline was faster than the fall Icarus must have had. You see, every vertical move gets burnt by the "Sun"; a.k.a. greed.
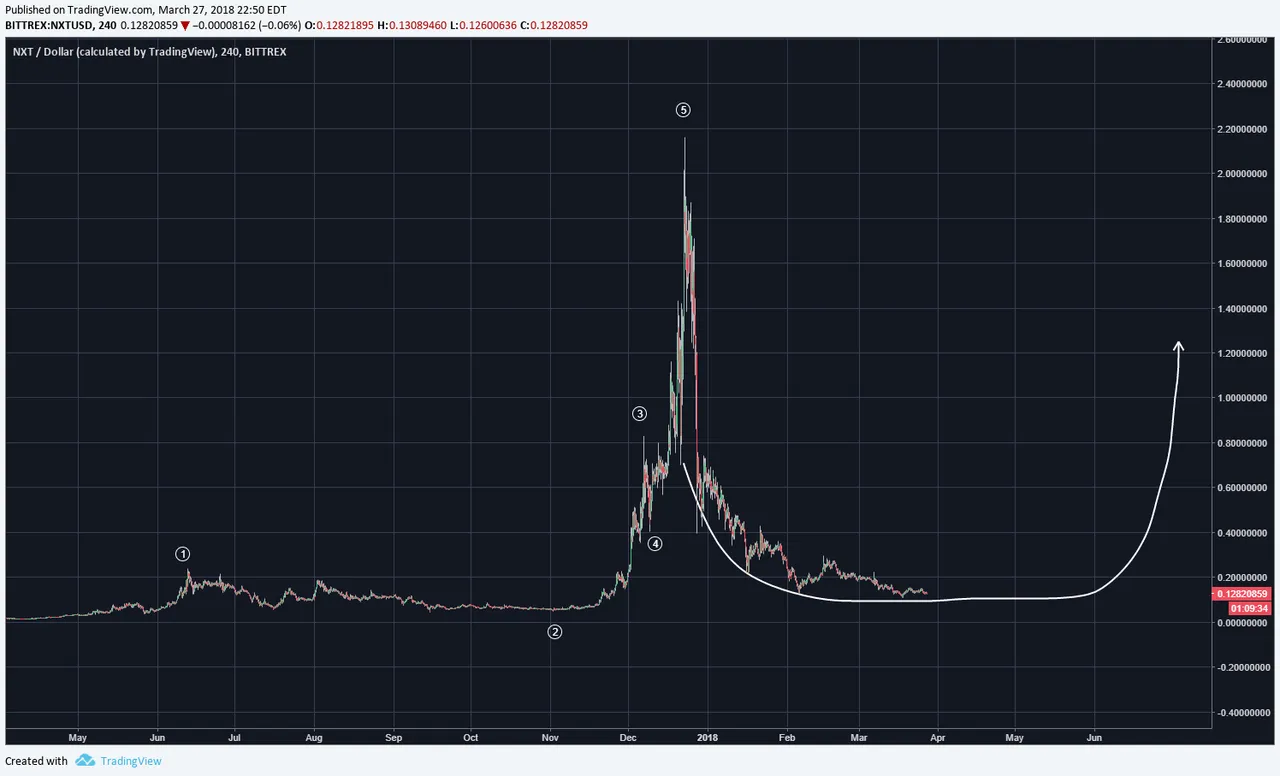
The correction is projected to be wide in time. The correction has already shown to be complex as labeled by wxyxz. the subwave of the final Z wave show the correction to head towards May. The price pattern is depicted to be the common rounded price bottom and the excitement of building the right side of the wall won't likely be until May or so. However, once the next round of impulse up occurs....do you think it'll be slow or quick/vertical?

Legal Disclaimer: I am not a financial advisor nor is any content in this article presented as financial advice. The information provided in this blog post and any other posts that I make and any accompanying material is for informational purposes only. It should not be considered financial or investment advice of any kind. One should consult with a financial or investment professional to determine what may be best for your individual needs. Plain English: This is only my opinion, make of it what you wish. What does this mean? It means it's not advice nor recommendation to either buy or sell anything! It's only meant for use as informative or entertainment purposes.
Please consider reviewing these Tutorials on:
Elliott Wave Counting Tutorial #1
Elliott Wave Counting Tutorial #2
Elliott Wave Counting Tutorial #3
Laddering and Buy/Sell Setups.
Laddering Example with EOS
Tutorial on the use of Fibonacci & Elliott Waves
@haejin's Trading Nuggets
Essay: Is Technical Analysis a Quantum Event?
Follow me on Twitter for Real Time Alerts!!
Follow me on StockTwits for UpDates!!
--
--

