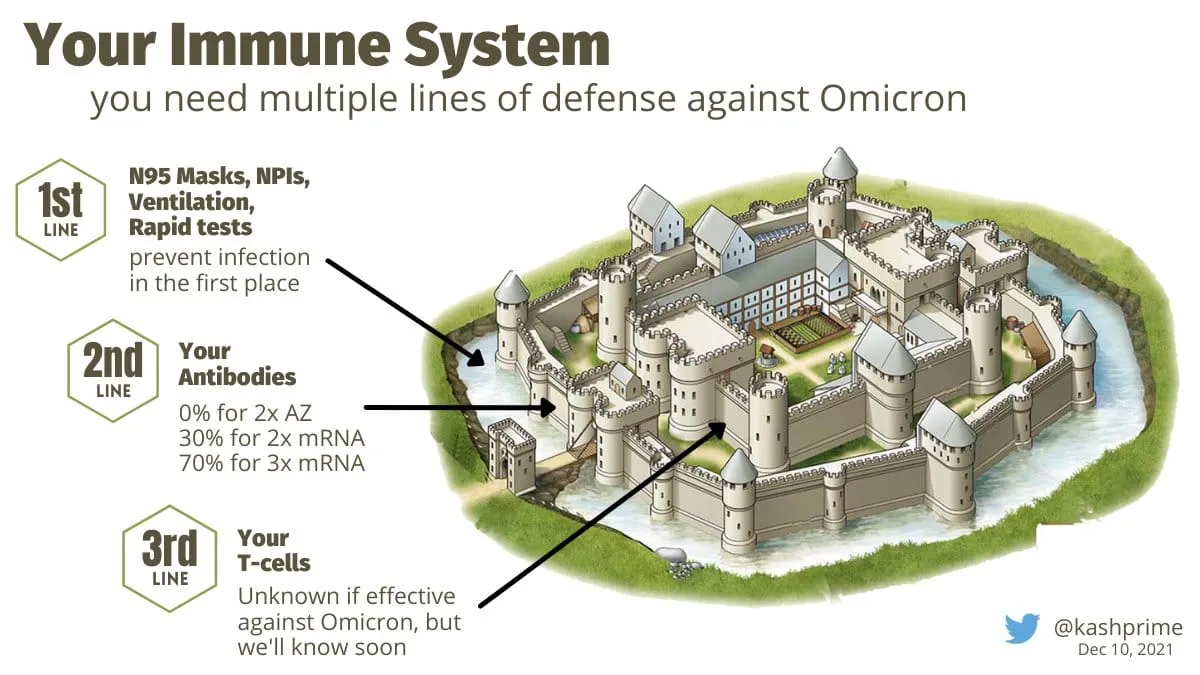
Nice graphic. Those %s in the 2nd line are in regards to vaccine effectiveness against symptomatic infection with Omicron based on the latest UK data.
Those estimates are based on a test negative case control method. It is a straightforward method used previously to assess VE against Delta. They compare the odds of vaccination in positive tests to the odds of vaccination in those who test negative. It avoids some of the confounding issues around testing bias.
However since Omicron is still at low levels in the UK, these estimates are based on very small case numbers. So the confidence intervals of these estimates are wide.
The real world effectiveness data is supported by several lab neutralization studies. The neutralization data suggests a 20-40x drop in neutralization with Omicron indicating significant immune evasion.
This data all supports getting your third dose booster as soon as possible to protect against the upcoming Omicron wave.
The 3rd line though is relevant as we talk about severe disease and hospitalization with Omicron. Lab neutralization is only looking at one part of the immune response. It is too early to have real world effectiveness estimates in regards to vaccine effectiveness against severe disease, which should be more robust. With other immune evasive variants like Beta we did see some reduction in protection against infection, but protection against severe disease was preserved. This is in part because the cellular immune response was still strong