Bitcoin couldn't break up 25K USD where is one of the greatest resistance. 200-week moving average is on 25K USD and we couldn't see weekly close above 25K in mini bullish season..
While Bitcoin was being traded in 16K, I shared lots of posts and said that mini bullish season was coming in new year. Lots of people were in fear and didnt buy discounted crypto..
Nowadays, I am sure that market maker is trying build a trap to hunt investors in 25K!
There are lots of signals showing Bitcoin price should go down!
One of them is Negative Divergence on Bitcoin Chart!
Negative divergence points to lower prices in the future. It occurs when the price is moving higher but a technical indicator is moving lower or showing bearish signals.

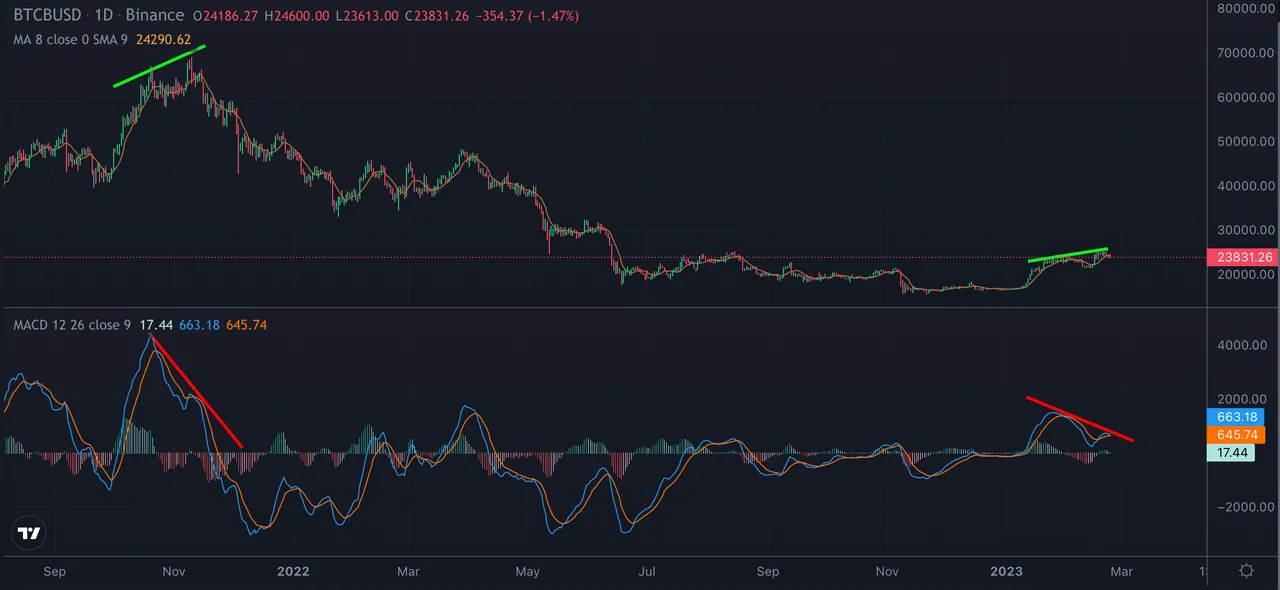
While Bitcoin Price making higher highs and higher lows, RSI making lower highs and lower lows.
Here you can see daily chart of Bitcoin and Bearish Divergence is on the chart!

Don't Get Caught in the FOMO
I shared another negative divergence on Bitcoin chart that seemed while Bitcoin price was on 69K USD..
We may see same move before big short!
I am warning all of you. Something huge is coming..
Take care yourself...