The Ethereum Merge happened on September 15th, 2022. It has been a long time coming but it finally went live. With this upgrade the Ethereum network has transitioned from Proof of Work (PoW) consensus to Proof of Stake (PoS).
This made the network more efficient and using less energy. Of course, everything comes with pros and cons and some believe that it made it more centralized and less censorship resistant.
Since PoS is a more efficient consensus, another key change was the reduction of the inflation for 90%. From 4.3% to 0.43% or in absolute numbers from around 13k ETH issued daily to 1.6k. This is without the burns.
Lets see how has the network performed since then.

Image background generated with Midjoureny
COVER
One important thing to note is that this upgrade was not about scalability and lower fees. It is a precondition for those but it’s not effectively doing nothing for lowering the fees. This should come later.
Here we e will be looking at:
- Daily Inflation and Burns
- Overall Supply
- Number Of Wallets
- Active Wallets
- Transactions
- Fees
The data presented here is mostly gathered from the etherscan charts.
Daily Inflation and Burns
This is one of the hot topics for Ethereum after the merge. A lot of people are saying that Ethereum will now become a ultrasound money with a deflationary supply.
This is because of the reduction in the amount of new daily tokens issued in combination with the burns that are coming from the fees. The burning mechanics was introduced in August 2021.
Daily Amount Of ETH Issued
Here is the chart:

This is an all-time chart for the amount of ETH issued daily for context. We can see that at the beginning there was a period with more than 30k ETH issued daily, then it dropped to around 13k.
We can see the effect of the introduction of the burning mechanism back in 2021 while ETH was still a proof of work chain. Because of the bull market and the high fees at the period there was a lot of ETH burned. But when the market pulled back, there was less burning and the daily inflation increased.
Then the merge happened in September 2022, and we can see the sharp drop in the amount of new ETH issued daily after that.
When we zoom in 2022 after the merge we get this:

We can see that there has been period with positive or negative numbers for the day. It’s a mixed bag. In the last month there is more ETH burned.
The amount of daily ETH issued after the merge has been oscillating between -2k to plus 1k
While these numbers might look significant when zoomed in, as we have seen from the previous chart, these are quite small numbers when compared to the overall supply of ETH and don’t change the supply significantly.
Supply
The overall supply now looks like this:

A steady increase in the supply from just above 70M in 2015 to 120M where we are now.
We can see that the last period after the merge the supply has been almost stagnant, a flat line!
The chart for the yearly inflation looks like this.

From more than 10% down to 2% in 2022, and slightly negative in the first month of 2023. This is still ongoing year, but it will most likely end very close around the zero mark, maybe a little bit positive or a bit negative.
When we zoom in 2022 - 2023 we get this:

Overall, ETH has been deflationary in the period. But for how much? In absolute numbers its around -15k ETH, while in relative number it is -0.012% that is very close to zero.
From this we can conclude that for now the Ethereum supply has been more like stagnant then deflationary after the merge.
Number of Wallets
Now for the general network numbers.
Here is the chart for the total number of Ethereum wallets created.

Ethereum now has more than 220M wallets!
It is the leading blockchain in crypto by the number of wallets. For comparison Bitcoin is still under 100M wallets.
When we look at the number of new wallets created daily we get this chart.

This is starting from 2022.
A steady number of new wallets created and then a spike after October 2022. From 70k up to 230k per day. A bit weird. Maybe some app was making a lot of wallets. After December 2022 the numbers went down again and we are now around 100k new wallets per day.
Active wallets
How many of the are being used?
Here is the chart for 2022-2023.
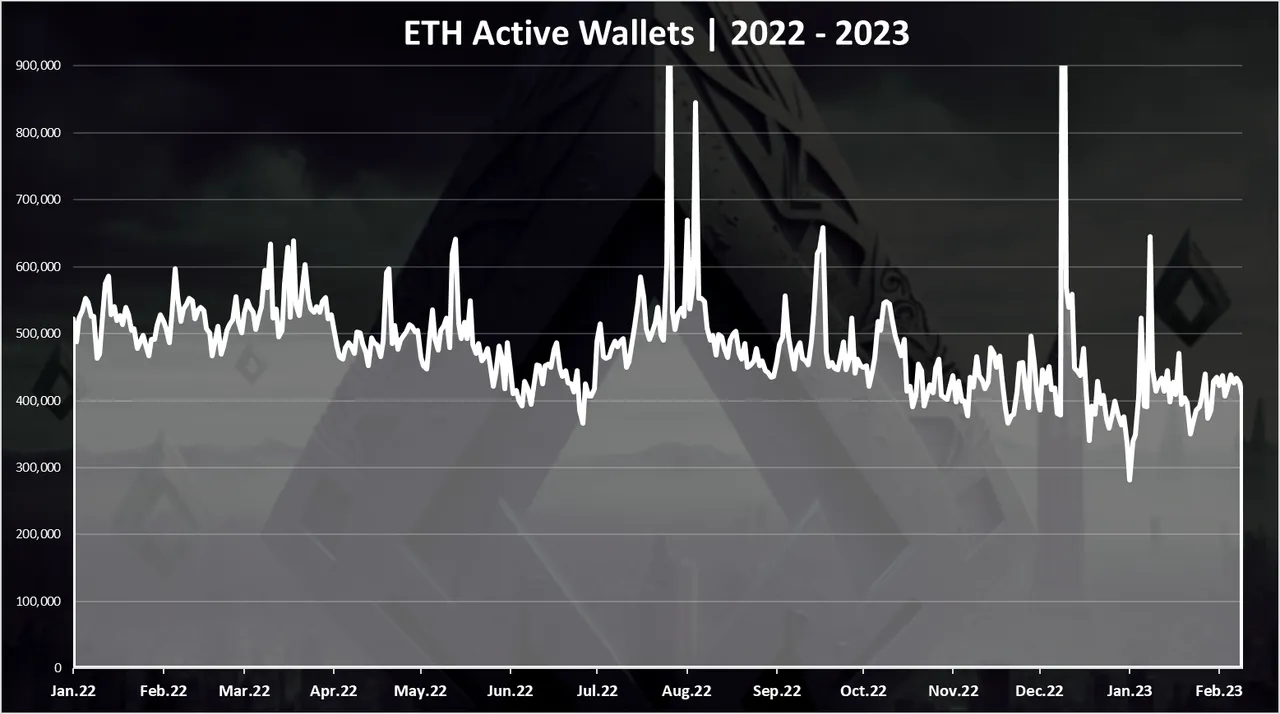
The numbers of daily active wallets have been quite steady through the year in the range of 500k to 600k DAUs. No significant impact from the merge here.
For comparison in 2021 during the bull market, the last year the number of active wallets reached an 800k per day.
Transactions
How about the number of transactions? Is the Ethereum network now more active after the merge? Here is the chart.

There seems to be a very small uptrend in the numbers of transactions per day, but nothing significant. At the moment around 1.2M transactions daily on the Ethereum network
Fees
There was misunderstandings that the merge will make the fees on Ethereum smaller. But this is not the case. The merge is a consensus upgrade, not a scalability upgrade. That should come later with Sharding. Here is the chart for the fees in 2022 - 2023.

The ETH fees have been going down in 2022, especially in the first part of the year, mostly because of a lower activity network. At the end of 2022 the average fees were in the range of 2$ to 3$.
We can see a slight increase in the fees again now, with the average going for 5$ per transaction.
The biggest impact that The Merge made on the Ethereum network is on its inflation. There are much less new tokens issued daily now, and with increased network activity this amount can be brought down fast. This was the case in the first five months after the merge when the overall supply dropped for 15K ETH. But still in relative terms this is a very slow decrease of -0.012%, meaning that ETH is now more of a stagnant then deflationary.
The other metrics, wallets, transactions etc, remains constant and in relation with the previous activity. There has been an increase in the numbers of new wallets created in the last months of 2022. The fees were low for the second half of 2022 and started to increase a bit in the first month of 2023.
The next steps for ETH are in terms of scaling. It will be interesting how this will be implemented and how will the network act in a next bull cycle.
