Bitcoin daily chart, Binance

Bitcoin has been very quiet lately - indicators in the middle, not oversold, not overbought - correcting the latest move down a bit and, by now, the chart points to another continuation move down, straight to a new low; but ideally above 5000$ finding support at the weekly trend line. The altcoins however, which have corrected a lot more than bitcoin, look like they're ready to bottom out. On top of that, Mike Novogratz, who, amongst other accomplishments, called the top in December, is now saying he believes the crypto market has bottomed by using his own weighted crypto index (https://www.ccn.com/mike-novogratz-says-the-cryptocurrency-market-has-found-a-bottom/).
Let's have a look at some:
Cardano

A massive drop from $1.39 to now $0.068. Clear divergence now between price and a slow MACD. It may be that they don't have a working product yet but volume is still enormous. Now volume on a Renko chart is deceptive as the percentage drops are not so large anymore and consequently less bricks are displayed per time unit, therefore one brick now represents a larger time unit and accumulates more volume per brick. Nonetheless people keep buying and you can argue just as well that we are in an accumulation phase that stamps a bottom on the chart.
Golem

GNT dropped from $1.38 to $0.11 and is now at $0.138. Not as large as Cardano but still an enormous drop. Notice the principled 3 wave decline from the top. Notice what happened with the price after the first divergence with the slow MACD and get excited from the divergence that is on display now.
Byteball

One of my personal favorites.
Byteball had a top of $1210, a low of $41 and is now at $58 and a bit. Divergence with both the MACD histogram and the MACD itself. The downtrend looks very tired now.
Bitcoin Cash
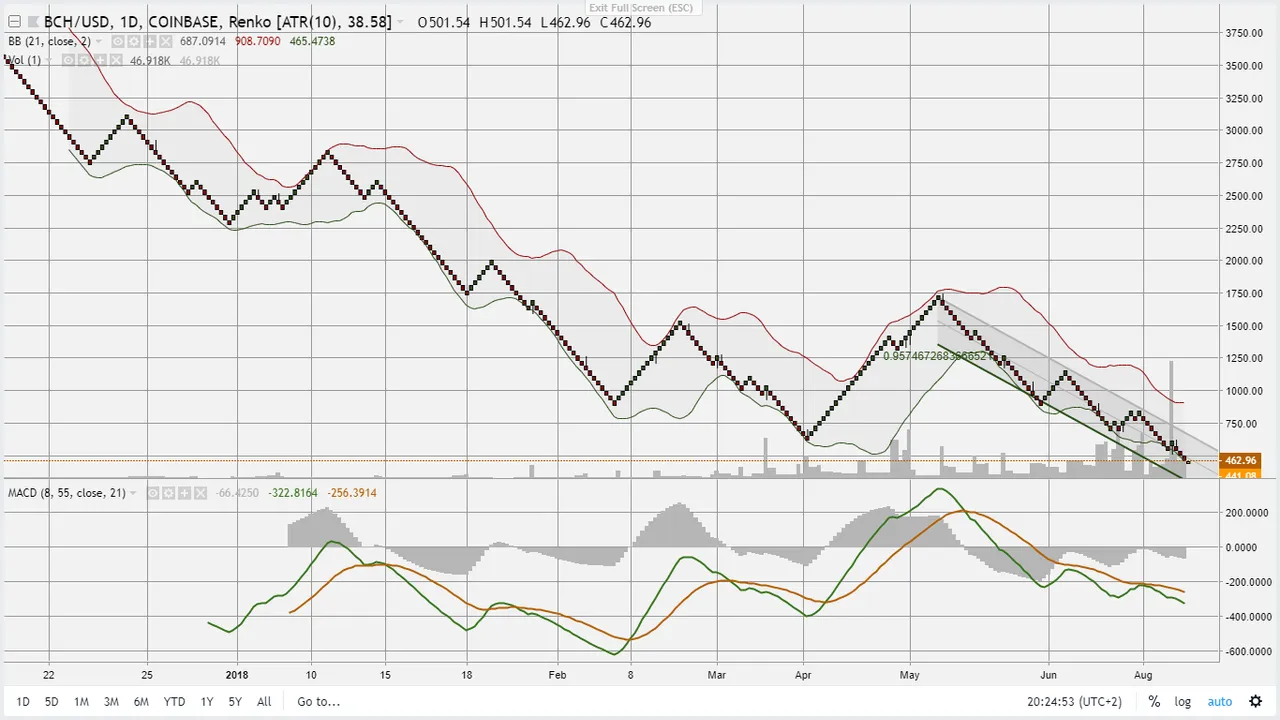
I don't like the coin very much but again, chartwise it looks very interesting: pushing against a Bollinger Band, clear divergences, the possibilities are to the upside.
Decred

Decred just made a new low in a beautifully principled 3 wave correction from the top. In Elliott terms this is called a flat.
NXT & XEM


Just look at these drops!
Zillica

Zillica returned to het starting point as if no development has been done in the meantime.
Ethereums


Ethereum however does not look like it has bottomed unlike Ethereum classic which has much stronger divergence.
Sia

Again, another slightly lower low with divergence. Sweety, what more do you want?
Po.et

One more.
Tron
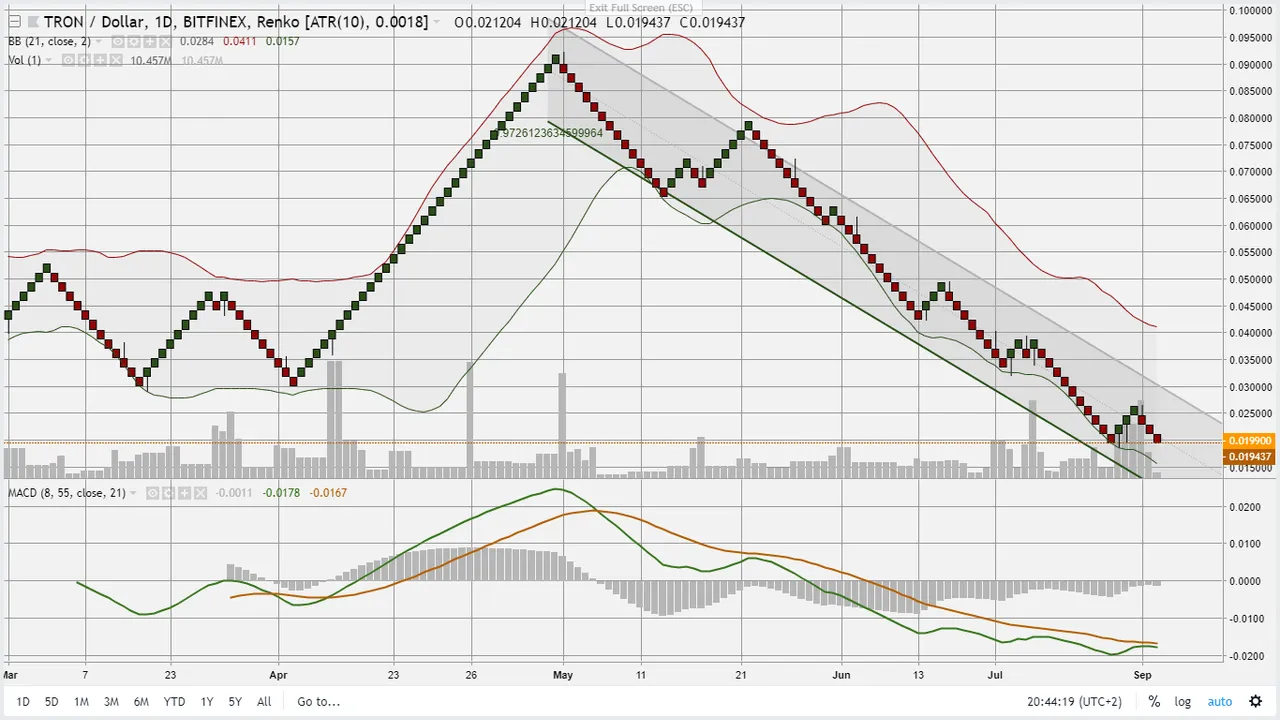
A little different, but still, huge divergence on the bottom of a Bollinger Band.
Then the supply chain coins: Walton, Wabi and V-chain


Civic

Populous

Augur

Qash

Qash seems to have broken out already as has Walton before.
All these coins display very similar behaviour (there are many more) and I believe therefore many altcoins are at or very close to a bottom. Now the question then becomes: can the altcoins pull bitcoin to higher prices which would be a reversal of the normal process.