The Hard Fork has come and gone. It was a wild ride, but now it’s time for some realism.
We laughed. We cried. We mostly laughed. We went to the moon and back. Well, not really – but at times it at least felt like it was possible. There was a ton of action over the last few days and especially over the past 24 hours. Let’s have a look at where STEEM was, where it went, and where it might be heading.
First, let’s take a look at the uptrend line on the 7-day chart that began in the $0.15 range. There was a nice, steady and gradual rise for three days. Then, around $0.23-$0.24, things became more interesting. The STEEM price quickly shot up to $0.28, then jumped up to about $0.34. After very briefly touching that price, it retreated back to the $0.28 range and back down to the uptrend line around $0.22.
We saw a big increase in volume from the previous several days – over $1 million in 24 hours of trading. Unfortunately, this volume proved to be stronger on the selling side. This is why it’s hard to get excited about low-volume price rises, which I had cautioned readers about over the last several days. When strong hands come in, they mostly control the market – and that’s what we’ve seen through much of the day today.

In a span of about nine hours, the STEEM price dropped from the high around $0.34 back down to $0.23 on very heavy selling volume. When we look at the candlestick chart from poloniex, we can see that there were some rather swift and large drops in the price on the backside of the high.
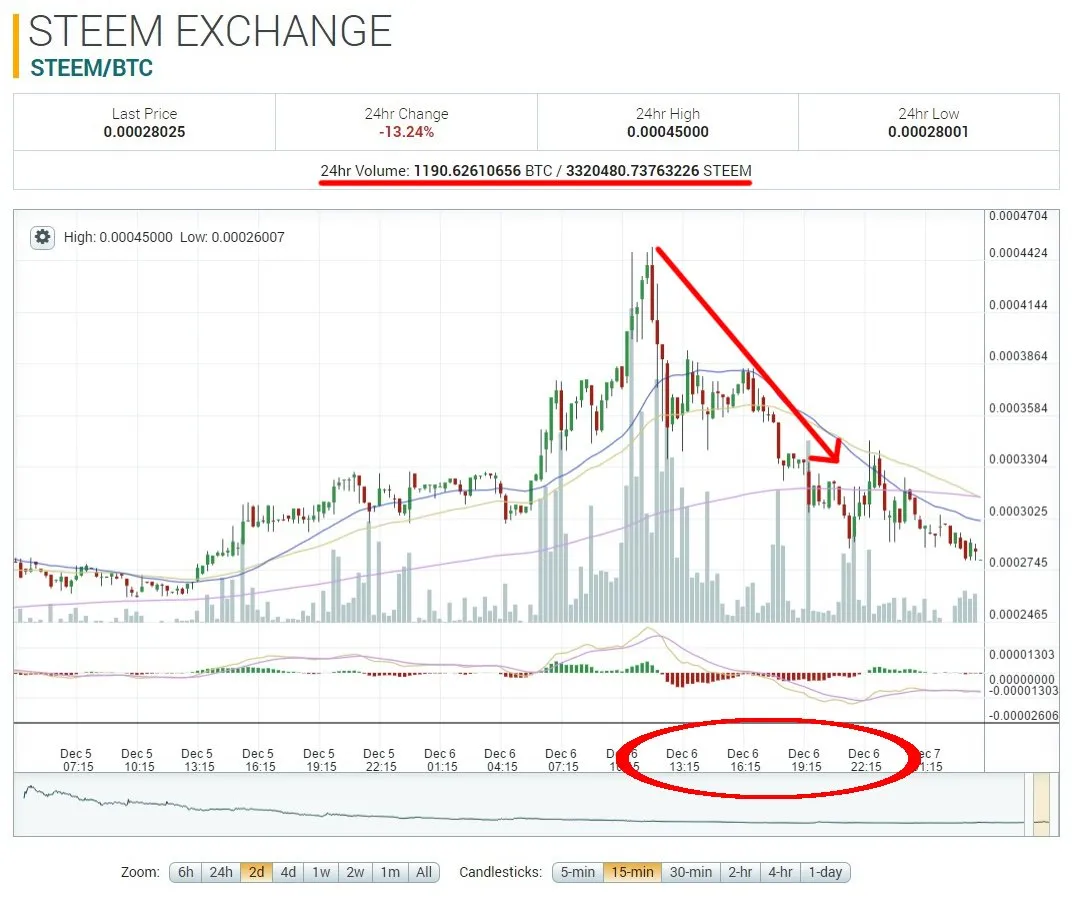
The pattern that we see on the chart is what is called a “head and shoulders,” if you’re not familiar with technical analysis. This typically indicates a reversal pattern that will push the price lower in the direction of the completed second shoulder. In this case, we can reasonably expect the STEEM price to continue down to the next level of support, which would be around $0.20. We saw in the first image that the uptrend line was broken, so we look to the next target for support below that line.
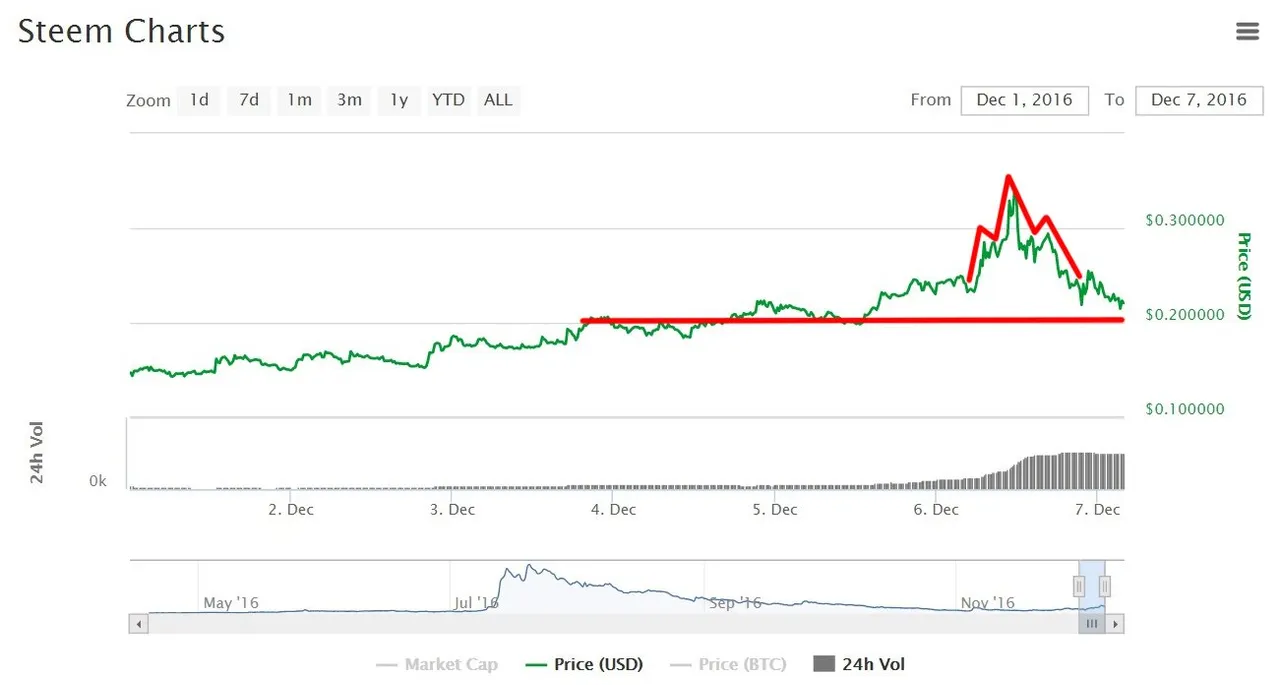
Looking at the 2-month chart, we can see the different support and resistance lines that were touched this week. The red line is the ~$0.34 high, the blue line is the $0.27-$0.28 range, and the orange line is the next level of support for the STEEM price, at ~$0.20. Prior resistance becomes new support and vice-versa. So, in order for STEEM to climb back to the recent high, it will need to break through the blue line. To reach the previous lows, it will need to fall back through the orange support line.

Whether the STEEM price can hold support depends on whether the buy orders can overcome the selling pressure. The depth chart appears to be skewed in favor of support, but it also looked like this through the night before the price fell back to Earth. The buy orders quickly stack up to approximately $25,000 at $0.19 and $43,000 at $0.15. But again – this won’t mean much if the orders are pulled or if large holders decide to sell.
The sell orders are a lot smaller to the immediate upside, with the first meaningful orders coming in at ~$0.27 with total orders reaching just over $35,000. So, there’s some wiggle room to the upside based on existing orders, but things can quickly change.

There are a couple of lessons to be learned here, and they are:
Buy the rumor, sell the news.
And...
Don’t try to catch a falling knife.
I’ll let you – the reader – try to see if you can guess how/where they apply.
Be patient. See how these new changes from the hard fork will play out. If there’s one thing that we can be happy about, it’s that there was a lot of buzz about STEEM over the past few days, so we may see some added attention and a lot of new users. Maybe once the larger stakeholders that want to exit have exited, we’ll see a healthier market that’s not skewed by those who didn’t want the large positions in STEEM that they initially had.
We may still have a rough couple of weeks ahead as the larger hands shake out, but we have a lot more data to look at and a little better understanding of how various bits of information can influence the markets. If you’re a trader, you can use that to your advantage. If you’re a long-term investor, you still have plenty of time to make decisions.
Overall...we survived Hard Fork 2016. Maybe we can do this again sometime.
Disclaimer: I am not a professional advice giver and this info should not be used for trading. I would be flattered that you think so highly of my fairly basic analysis, but it would not be prudent to use this for trading with real money.
*Charts are from coinmarketcap.com and poloniex. Data is current as of 11:15pm EST, December 6th, 2016.
