
The STEEM-BTC price appears to have found some support and is moving slightly upward at the moment.
In last week's Price Analaysis post, I wrote
To the downside, the STEEM-BTC price can drop between 39-43K satoshis, where some fairly strong support had been built during trading in May and early June.
And
As for the STEEM-U.S. Dollar price....If it moves back below ~$0.98, then we could see prices fall to $0.70 - $0.80.
Both of these happened three days ago. The STEEM-BTC price dropped down to just under 40K satoshis and the STEEM-U.S. Dollar price fell to ~$0.78, then both quickly recovered and have been trending upwards since then.
It just so happens that the Bitcoin price has done the same thing. So as much as we might want to see alt-coin prices decouple from Bitcoin, it doesn't look like it's going to happen any time soon. Whatever the sentiment is with Bitcoin and how it is viewed by investors/traders inside and outside of the regular cryptocurrency markets, the same will mostly apply to the rest of the tokens, whether we like it or not. We must always remember that when we consider investing or trading in these markets.
That being said, there are plenty of moves within the market that can be used to increase returns or to take a long-term position, so let's look at the current STEEM prices.
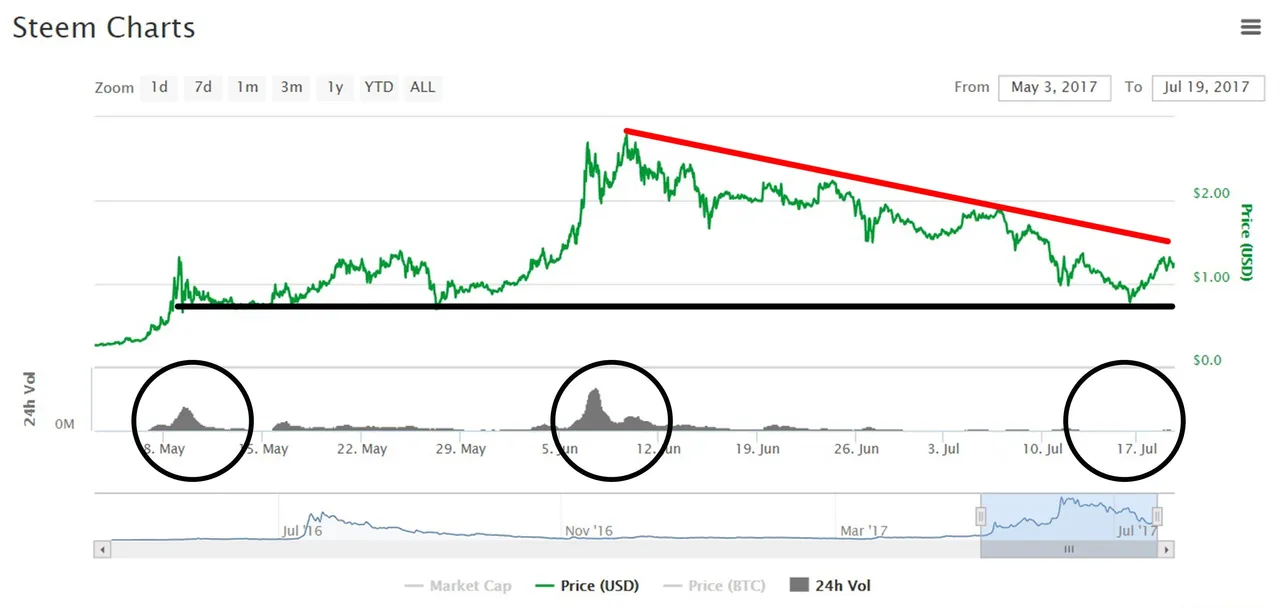
On the daily STEEM-BTC chart, we can see that the long-term uptrend remains intact (blue line). Even with the recent spike downward, the lowest prices over the past week were still a good distance away from touching it, but the gap is certainly tightening. The six-week downtrend also remains intact (red line). Prices will continue to be squeezed until one or the other gives way to a prevailing trend, which has been bullish overall since March.
Other than a couple of relatively quick spikes downward, the STEEM-BTC price has found some support around 44K satoshis (black line). This recent support adds to previous support/resistance lines, so we might not see prices fall below these levels unless there is a much stronger sell-off with Bitcoin and the overall cryptocurrency market.
The STEEM-BTC price is currently ~54K satoshis.

Looking at some of the technical data, we can see that volume still remains low (red line). Overall, volume has been much lower than any trading day in the past eleven weeks.
We can also see that the STEEM-BTC price is moving up towards the 20-day moving average, but still remains far below the 50-day moving average.
The MACD shows a possible pending crossover of the signal lines, pointing to a reversal in momentum to the upside.

The STEEM-U.S. Dollar price recently fund some support around $0.78 and quickly turned around. This occurred in the same range as previous support, including the last turnaround that kicked off the jump into the highs in June. The price is approaching the recent downtrend line, but as we can see, volume is still very low compared to previous moves. The current STEEM-U.S. Dollar price is ~$1.26.
What can we likely expect from STEEM prices?
Given all of the recent drama with Bitcoin and their potential hard forks, anything can really happen. There's no predicting what the large investors or anyone on the sidelines might do. But looking at the data and some of the points that are possibly converging, we can look at some of the potential outcomes.
The STEEM-BTC price trends are converging at the same time that the moving averages and momentum are looking to be tested and reversed. With volume as low as it has been, a large move can be made relatively quickly with few participants. If volume increases significantly on a move in either direction, we will have our answer about which trend will prevail.
My opinion is that the uptrend will continue and that a lot of the uncertainty about Bitcoin has already been priced into the market. We are less than two weeks away from the big August 1st drama, so I don't believe we'll see any large sell-offs unless something completely unexpectedly bad happens. As long as Bitcoin prices aren't dropping dramatically, the STEEM-BTC price has good potential to make some gains.
The price may be in a trading range for now (black lines, below), so we'll need to see if it can break out above the 20-day moving average and the downtrend line (red line), which currently points at ~62K satoshis. If the price can clear 57K (the current 20-day moving average on Poloniex) and push up through 62K, then it could be on its way back to the 70s.
If the price tests the 20-day moving average and fails, we could see it trade sideways until it gets closer to a convergence point with the two trend lines which would still be a couple of weeks away.
If prices do happen to take another dive from Bitcoin uncertainty, then we'll be looking at another test of support between 39K and 44K satoshis. If those don't hold, then the uptrend line would be the next test of support, currently at around 34-35K satoshis.
Continue watching the volume for confirmation of any big moves.

If you're trading, always remember:
Never invest or trade what you cannot afford to lose and put tight stop-losses in when prices creep lower towards the support lines.
As always, if you have any critiques or comments about my non-professional analysis, please let me know. If you decide to trade this market, good luck to you!
Disclaimer: I am not a professional adviser and this info should not be used for trading. These are only my interpretations and opinions, and while I would be flattered that you think so highly of my fairly basic analysis, it would not be prudent to use this for transacting/trading with real money.
*Charts are from Poloniex and Coinmarketcap.com. Analysis is current as of approximately 2:00pm EST, July 19, 2017.


