Hi everyone,
Today I want to share some of my views on Steem and the potential of moving up in the recent days. Please note my opinions are for reference only, and please do not treat as financial advice.
Chart provided by TradingView
Exchange: Bittrex
Timeframe: D

From a long-term view (daily chart), we can see that Steem is approaching the long-term support area ( 10500 sts) and in the past, we usually observed a bounce from that area.
A closer look

When we take a shorter period, we can see that Steem is in a consolidation period, in which volumes were increasing in some periods (check the red circle). While there was no significant move, but I do expect a breakout soon, to retest the EMA-89, which is 15000 sts area.
Smaller timeframe: 4H
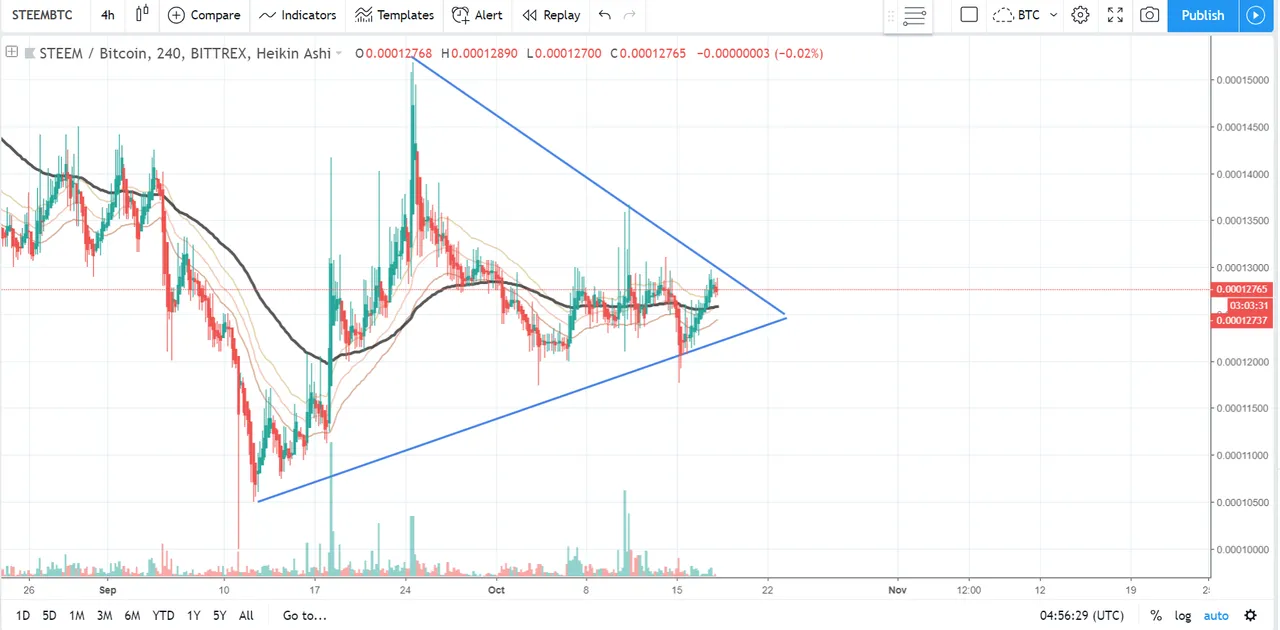
For a smaller timeframe, we can see a triangle formation is forming, in which Steem has tested the upper trend twice. In the best case, we will see something like this:

With that setup, STEEM will reach 15000 sts area, to test back the EMA-89 line of D frame.
Hope you find my analysis useful.