When doing analytical posts I try to use lots of diagrams and layman’s terms. I don’t always succeed in making things easy to understand so feel free to ask questions or challenge my conclusion and I’ll try to respond to all comments. As I began writing this post I was literally asking the question – "Are we ready for another BULL RUN?" I can see that the Crypto market is picking up again and we could be off to the races once more but I want to know if STEEM is a good place for me to be allocating my Crypto funds.

I have long considered that the System Debt Level is a very important factor to consider with regards to the underlying economic model for STEEM and as I’ve written about it a number of times in the past it is a logical place for me to start. I explained the chart below almost a year ago with my post Impending STEEM DOLLAR Purge : The #1 Key Indicator To Watch so if you need a refresher please check that out. You’ll notice that the Green and Yellow lines were changed during Hard Fork 20 in September 2018 as the SBD Print Reduction Threshold was changed to 9% and the SBD Printing Halt was changed to 10%.

All of my charts for this post start early August 2018 as it was early in this month that we first had a complete SBD Printing Halt (crossing the orange line). Thankfully the SBD price finished coming back to earth at about the same time and I wrote The STEEM DOLLAR Purge Begins : This is what we need to DO. As you can see HF20 shifted the goalposts and we resumed SBD Printing for a little while, but it got pretty hairy for a while there when System Debt broke the SBD Haircut Threshold (red line) in November. You can see from the chart below that the SBD Price collapsed very quickly at this point and it wasn’t until February 2019 that the Debt Level and the SBD Peg at $1 US Dollar recovered.

Since February 2019 the broader Crypto market (and STEEM) have been consolidating and recovering. The System Debt level has hovered around the 6% mark and the SBD Peg to $1 US Dollar has been relatively stable. These are both fairly encouraging developments but are they enough to start getting confident? Well, let’s look a little bit deeper at a few more charts. You can see from the above chart that the SBD has been fluctuating either side of $1 US Dollar for the last few months. Whenever it is below $1 US Dollar AND the System Debt level is (comfortably) below 10% there is an economic incentive for SBD holders to convert their SBD to STEEM in a process I’ve been calling a “Purge” of the oversupplied SBD to further reduce the System Debt.

The above chart shows the SBD conversions that have occurred over this period and you can see the big spike during November when I really cemented my reputation as a STEEM Doomsayer with my post STEEM Dollar Purge Update : The Bonfire has been lit! But more importantly you can see that there has been some pretty steady SBD Conversion going on through-out 2019 so far with maybe only a slight pause in late March – early April that corresponds with the SBD Price pushing above that critical $1 US Dollar mark. No surprises about this correlation.
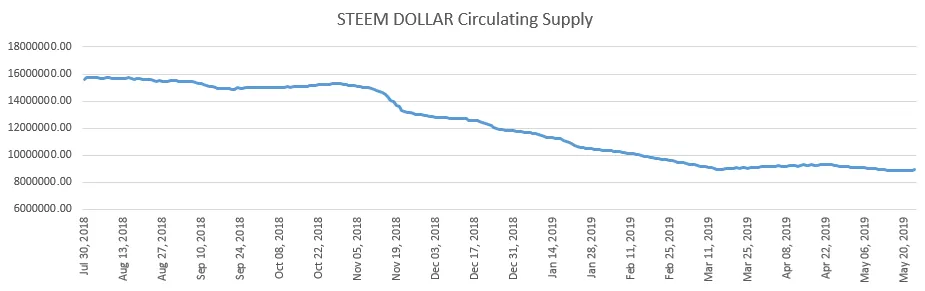
The next thing I wanted to look at was how the total Circulating Supply of SBDs had changed over this STEEM Winter period as to me it represents Nett Debt for the STEEM economy. I was pretty encouraged to see that the total SBDs in Circulation had been Purged down from almost 16 million to just below 9 million at time of writing. It is a pretty clear trend downward and the ongoing SBD Purges have reduced the Nett Debt by almost half. Finally I wanted to try and pull all this data together in another old chart I first used when SBD was at $7 to predict STEEM DOLLAR Will Fall To $1 USD : Here’s Why

You can see the Blue line representing new SBDs Created which flat-lined at zero while we had SBD Printing Halts in Aug to Sept 2018 (pre-HF20) and again from Nov 2018 to Jan 2019 when the Debt Level spiked above the Haircut Threshold. While the Red line representing SBDs Destroyed spiked heavily at the peak of the SBD Purge in Nov 2018. However, as we come into April and May 2019 we can see volatility drop off and a bit of equilibrium return as the Green line representing Nett SBDs (Created minus Destroyed) gets closer to zero.

In conclusion is does look like the worst might be over and STEEM once again has a bit of room to move in either direction without debt being a problem. Going forward I would think that if the SBD price can stay in that sweet spot near it’s intended peg value of $0.90 to $1.10 USD then we won’t get a new build up of fresh Debt. In that case the economic system should be fairly stable and the System Debt Level as a percentage will approximately track the actual STEEM price. That means that if we are indeed at the beginning of a new Crypto Bull market and the STEEM price can double in coming months then the System Debt Level will roughly halve from here and the risk of fresh SBD Haircuts on conversions (in the short and medium term) would be low. There are obviously a lot of other factors at play but I’d expect that this would be enough cause for optimism among the ranks of STEEM and SBD stakeholders.
So YES – I think STEEM is ready for the next BULL RUN
DISCLAIMER – This information is for general information only and should not be taken as financial advice. I am not a financial adviser and I encourage all readers to seek independent financial advice before investing in STEEM or SBDs.
