Over three months of modeling STEEM, the models have proven uncannily accurate, repeatedly indicating precisely when Price will trade through a plotted point known as an EXIT.
Jan13
I started this series using a 4-hour chart. There wasn't much in the way of prior parabolic peaks to look at, so moving to a shorter time interval shows more action.

LOF assumes that forces on the model are continuous across the model, so I was hoping to find indications of what the daily forces were by examining this chart. Having noted a possible EYE, I expected price to decline.
Jan16
The Fall Channel Control Line has been accurately plotted. We see Price was unable to overcome the suspected EYE and fell through the Control Line to find support on a reflection below.

Feb15
By now I've moved on to working the model on a daily chart. A strong EYE has been identified, as have the initial Fall Channel and Control Line CL1. This model shows Price has touched the EYE four times and is currently attempting to walk across.

The beginnings of the Extended Fall Channel are being plotted. We see that Price dipped very low to touch on a Long Term force line. This day's Price was rejected near a reflection of CL1.
Feb23
Subsequent analysis showed a double reflection of CL1 which formed a minor EYE. Price was rejected hard and a new Fall Channel was plotted, plus an additional probable secondary Fall Channel, each with their EXITS shown.

Feb26
Price works through the first EXIT. I didn't expect to see Price hit the second EXIT...

Mar2
But true to the implications of LOF, Price took a quick ride up to kiss the EXIT before returning and continuing its journey to the third EXIT. (Note: LOF does not predict the future. It is very good at indicating probable points in time and level that Price may pass through.)

I noted that Price must close above the Long Term line LT1 for any rise in Price to continue.
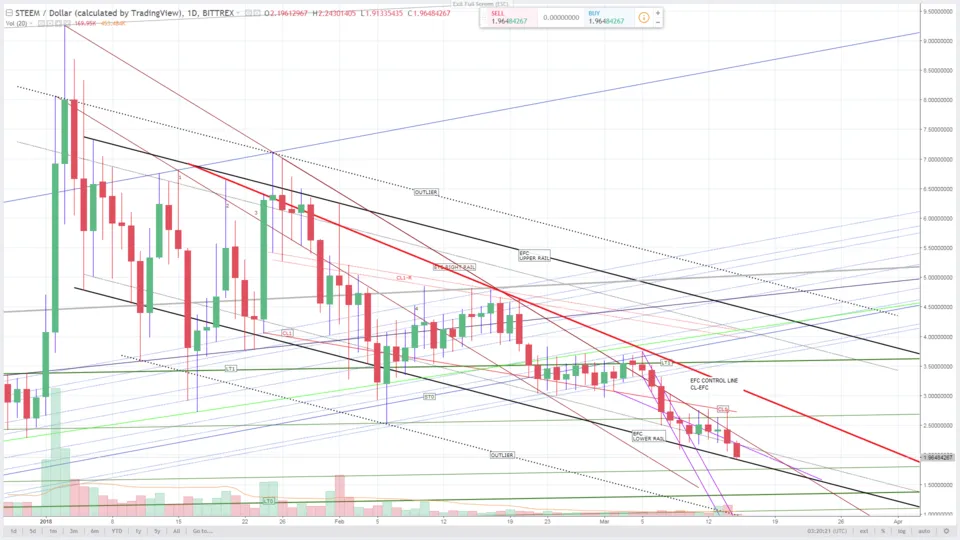
Mar12
Price rose somewhat strongly and lifted itself past the Right Rail of the EYE. But it was a false start, and Price quickly returned to its southerly trek. A new Fall Channel with a new local Control Line.

Mar15
Here I let my emotions come into play. You see a huge red line down and to the right. Yeah. It's called a Ringing Control Line and sometimes it means a lot. But in this model the EYE and CL1 work within the Extended Fall Channel to create that line, so it's in a sense a derivative line that shows something, but doesn't really control anything. But it set the stage in my mind for what I thought next...
Mar18
I modified the Fall Channel that was correctly drawn already, and made it into something that didn't actually exist. I joined two fall channels together. Big No-No. Which gave me an erroneous EXIT. I could say I had other things on my mind. I could say I was pretty damned sick. Both would be true. But neither is an excuse.

Added experimental Control Lines CL0 and CL0A to see if they will indicate an EXIT from the Extended Fall Channel.
Apr3
By now I've seen my mistake and removed it. Also cleaned up the model a bit to make it more intelligible.

Price finally seems to have found a true Support at LT0. Only one possible true support remains below, the Baseline. Price went on a tear to test LT1 before returning to continue plodding upward.
Apr10
Price continues its relentless journey across the Extended Fall Channel, inching its way toward LT1. Control Line CL1 is the only obstacle at the moment.

Apr13
Price leaps across CL1 with gusto, attacking LT1 before returning to establish a mirror of the Short Term force we found in the parabolic rise. A new trend appears to be establishing itself and Price finally closes above LT1 for the first time in over a month.

Apr14
The influence of CL1 is waning. Price has remained in the vicinity of LT1 for several days. But I don't expect it to stay that way. Price is still well inside the Extended Fall Channel. Volatility will most likely continue. Good luck!

Learn more about Lines Of Force HERE
All images mine.
NEVER TRADE YOUR MONEY BASED ON MY WORK OR ANY WORK OTHER THAN YOUR OWN. MY WORK LOOKS AT PRICE AND PRICE ACTION OVER TIME AND IS FOR ENTERTAINMENT PURPOSES ONLY. NO TECHNICAL INDICATORS. NO FUNDAMENTAL ANALYSIS.
IT'S YOUR MONEY. PROTECT IT.