
Here is the weekly chart for Steem from the start in mid 2016, quite a 'wild' ride up and down.
After a dramatic rise going into 2018, the price fell just as fast as the entire crypto market was in a bear market.
There are now 4 green heikin ashi bars which illustrates the bullish trend
Price is above the 20 week moving average which is a bullish sign
Stochastics are on the upswing, bullish

The daily chart shows the price rise which stayed over the 20 dma (yellow line)
The 20 dma crossed over the 50 dma (blue line) which is typically bullish.
Stochastics have rolled over from the ~80 level, but may have paused here as price is trading sideways.
With most of the top cryptos, they tend to rise and fall with BTC...

Here is a daily line chart of Steem in Blue and SBD in Red. Last year, they traded 1:1 for months before SBD disconnected and went on a price spike.

The correlation between BTC (red) and Steem (blue). It appears correlated sometimes, but then disconnects.

There seems to be a little more correlation between ETH (black) and Steem (blue)

The Steem marketcap is now over 1 billion and sandwiched between these popular cryptos. (From Livecoinwatch)

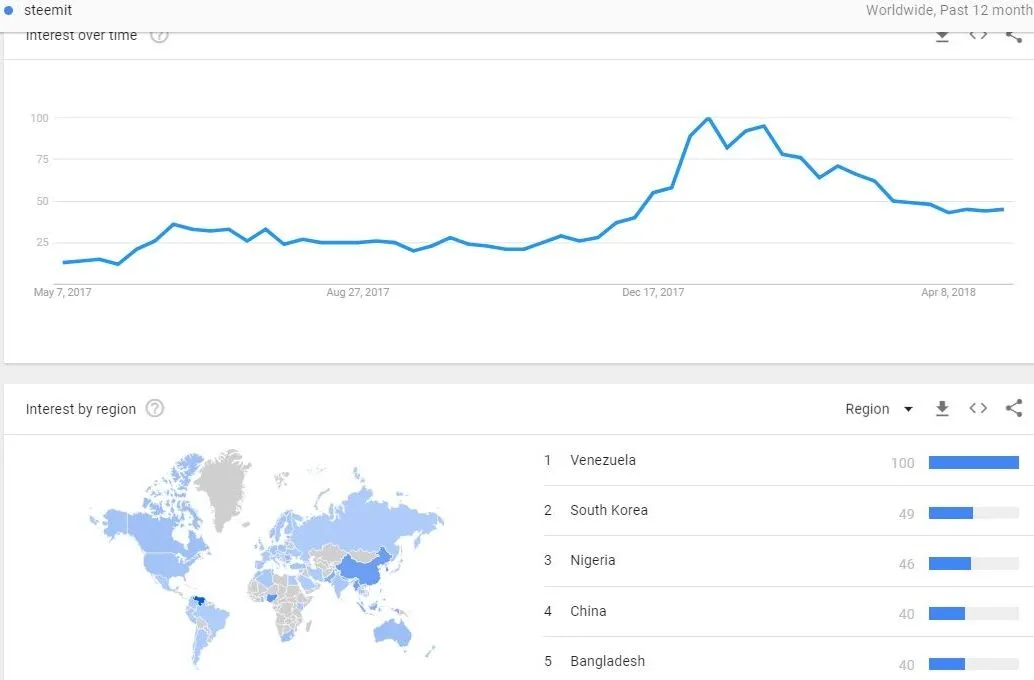
Google searches for Steemit have leveled off with the crypto bear market. I would expect a rise in searches as long as the bullish market continues. Venezuela has been in the number one spot for months.
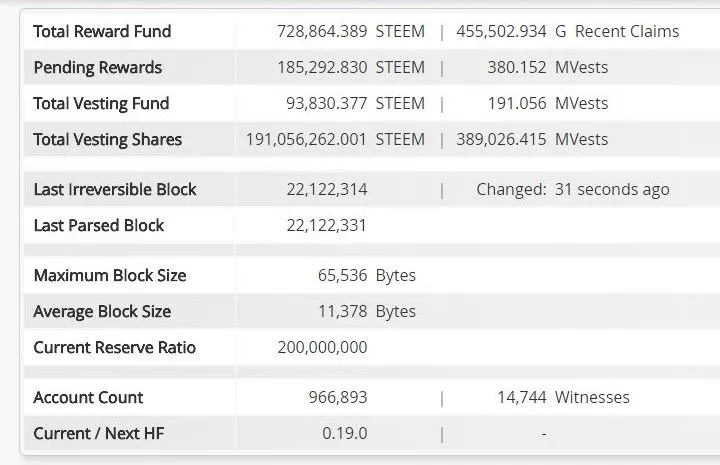
Total Steemit accounts are at 966,893 and rising each day. 1 million accounts should be met this year... Based on some statistics that I've seen, the retention rate is somewhere between 6%-8%...
For me, I'm hodL'ing!!!