Bitcoin has once again breached the $9,000 range and has continued out of the months long down trend. However, there are still some warning signs we should be aware of here.
On the bullish side, trading veteran Peter Brandt has said that Bitcoin could surge to $21,400.
Brandt believes that such a bullish scenario is possible if the upper boundary of a descending parallel channel, the 18-day moving average, and the 3-day trailing stop rule are able to hold. However, if these support levels break, then Brandt expects that a “more serious correction†could take place.
Below we will take a look at the charts and see what information they give us.

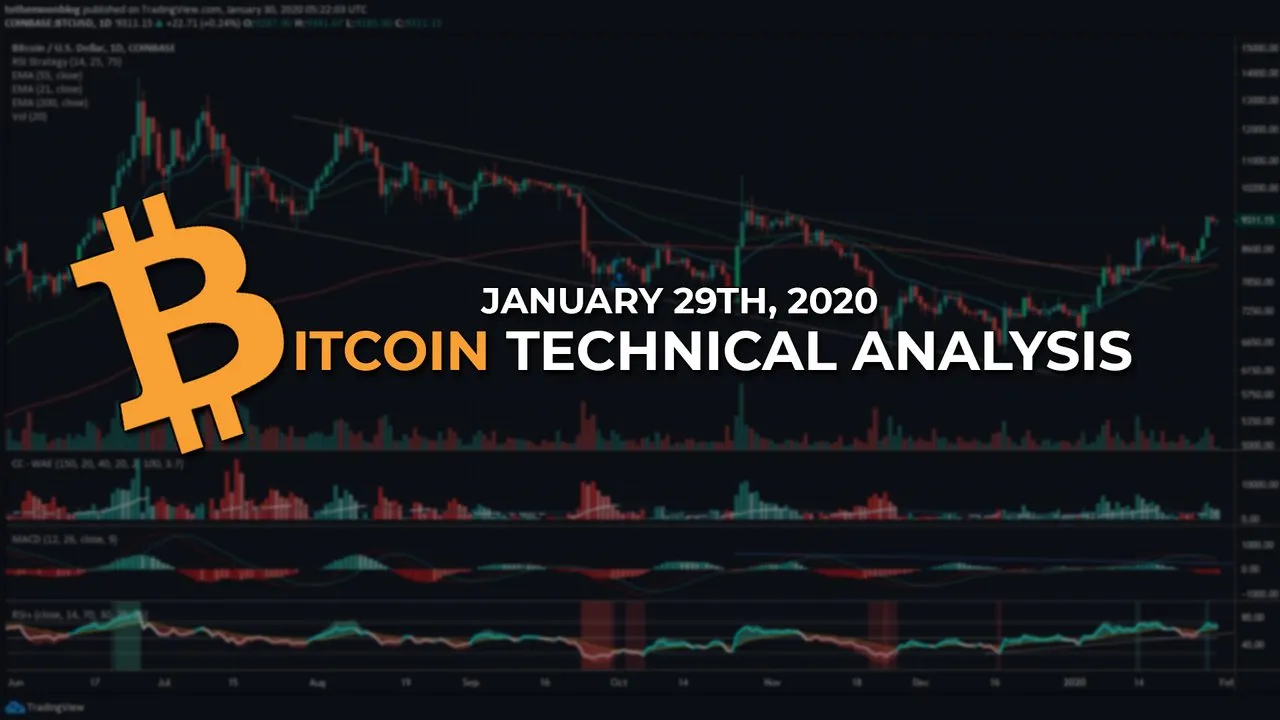
Bitcoin daily chart for 1-29-2020.
Daily Chart
On our daily chart, we can see that on January 24th we had a clean bounce off of the 200 EMA which is a good sign.
Since then we have had a nice little pump that has pushed the price up into the current range of the $9,300 region. Despite the pump, we have yet to create a new lower-high on the daily chart. To do this, we must break $9,555.
It's worth noting that an increase in demand for the cryptocurrency could jeopardize the bearish outlook.
If Bitcoin is able to close above the recent high of $9,170, then it could continue climbing up to reach the next level of resistance which would be $9,555. The last lower-high given in the bear trend.
After that we could look for resistance given by the 127.2 percent Fibonacci retracement level. This resistance level sits at $9,800.

Bitcoin daily RSI for 1-29-2020
Daily RSI
Here on our daily rsi, we can see a clear trend upwards which is indicated by the yellow diagonal line.
The yellow horizontal line is looking for signs of bearish divergence which we have not yet seen. Be on the lookout for a bearish RSI divergence as a possible indicator for a price correction.
The RSI is currently pointing towards the upside, but I am personally looking for it to potentially start to tire out in the next
 |
|---|