
This post is a kinda response to a conversation I was having with another Steemian that I follow, 
It's going to be a loooong post, and probably won't be of much interest to anyone except him or people who want to learn price action trading. It's one of those things, if I was doing it in person it would take two minutes, or maybe a 5 minute video, but doing it in text means it's going to be a lot of writing and diagrams, sorry. All I can say is there might be some hidden gems in there, some of which I plan to write about in more detail in the future.
The disclaimer at the start - reading a chart after the fact is very easy to do, it's much harder reading the right edge of the chart in real time. I've written about this before, how easy it is to recognise patterns that don't really exist until you see them in hindsight. A lot of people on here make a living out of doing just that...assholes, giving people false hope when they don't even trade themselves.
What I write and how I read charts is also very subjective. It may be completely wrong but, and it's a big but (no comments !), it works for me ! That's the beauty of reading charts yourself, you can make up any kind of story or reason for explaining what's going on and it doesn't matter. If it makes you money, ie gives you a positive expectancy then it works.
I used to trade what are known as 'liquidity pools'. It's times where the market reaches a state of efficiency, think of it as the price bouncing within a range, because that's what it means. To get my head around it I thought of a chart as being a series of waterfalls, with fish jumping up and down into individual pools of water. One fish would jump up the waterfall to the next pool, and all the other fish would think "hmm, where's he going ? must be some food up there" and then they'd all start to follow. This is the start of a trend.
Eventually, there would be a steady stream of fish all 'following the leader' until the higher pool was now just full of fish all milling around, eating all the food and getting hungry again. This is the ranging / efficient market phase. And then one fish would jump to another pool... Sometimes a fish would jump up and fall back into the same pool, and others would follow it (false breakouts, price tests. You can actually see this on charts, that's exactly what it looks like !
Clearly it's not fish jumping up waterfalls that moves price in the real world, but in my mind it's exactly how I imagined it. And like a scientific theory, my theory made predictions that I could test and act on, and it worked for me.
The point is, it doesn't really matter what story you spin to explain what you see on a chart, it could be entirely wrong. However, if the story has predictive qualities and it makes you money then it's not wrong for you !
Enough of the chatter anyway, this is the way I read my charts. Deep breath, go make a cup of tea before starting...
My fellow
Try to pretend the right hand side of this chart hasn't formed yet, I could have edited the pictures to remove all the information but I couldn't be bothered, lol, just use your imagination as I go through it :-)
So we start off at the left hand side of the chart (I'll highlight the parts I'm talking about). Normal chart stuff, trending up.

The price follows the same pattern as every other trend, impulse, correction, impulse, correction. It always looks like this, but it's important to recognise the pattern. I probably don't need to spell it out, but higher highs (HH) and higher lows (HL), big candle up followed by smaller candles down, but the overall direction is up.

Then we hit a period of consolidation, a ranging market. Price is lazy and not going anywhere but sideways. The bulls are taking a breather here, maybe pausing before another push up. Or maybe the bulls are exhausted and the bears are going to take over. It's a 50/50 chance either direction at this point, anyone who says otherwise is a charlatan, medium, mind reader or has insider knowledge. "I predict the market has topped and is about to...". Bullshit, you don't know, no-one does.

You could put buy and sell orders above or below the range and hope for a breakout, but it's a 50/50 chance of success. But at that point you wouldn't know what's coming so how would you know if the risk of a buy (for example), with a stop loss below the range, would push the price high enough to make a decent risk /reward ? You don't, so you don't trade it. There's no target on the chart so you can't calculate it, don't waste your money. Remember, we trade on probabilities, not just wave a finger in the air and guess.

Because of the previous trend direction, it would make more sense to put a buy order above the previous high and hope for a breakout to the upside. Trends always continue in the same direction until they tell you otherwise. But you just don't know at this point, it would be a guess, no trade. It could just as likely be a false breakout that opens your buy order and then plummets straight to your stop loss, that's a retail traders entry (and loss), stay away.
If for some reason you were convinced the trend was going to continue higher, you would have a buy order at the bottom of that range with a tight stop loss. That's a professionals entry.

Compare that to a retail traders entry, which would be a breakout above the high. Can you see the big difference in the risk reward levels ?

It doesn't matter, I wouldn't have taken that trade because until that point, there was absolutely nothing telling me the price was going to breakout and rise to the level it did, so I couldn't quantify the risk / reward.
Just something I want to point out though, the retail trader would have made a 1:4 risk reward on that trade, whereas the professional would have made 1:15. Which one do you think is worth the risk ?
On with the story...
So something happens, don't follow this stock so can't say, probably some news item, air drop or whatever it's called, and there's a sudden interest in it that pushes the price way high.

Look at the step in the middle though, there was some hesitation and a slight retrace (impulse > correction). You could have made a pro entry there at the bottom of that red candle, with a stop set only a few points away. That could have made a R:R of about 1:20 or more. Compare that to the retail traders entry, which would have been a break above the high, with the stop in the same place, 1:3 or something.

Don't forget, this is only easy to do in hindsight as I warned at the start, doing it live is another thing. But compare the risk rewards here, if you can make 1:15 risk reward trades then you only need to be right 1/15 times and you'll still make money. To win as a retail trader you need to be winning at least 50% of the time which is an awful lot harder to do.
So price then hits a brick wall at the top and there's a sudden sell off. Probably the cleverer people taking profits at this point. A good thing to point out here and it's something I always talk about - for every buyer there's a seller and vice-versa. So when the clever people at the top were selling out and taking profit, who were they selling to ? Someone had to be still buying away up there, and all the way back down as the stock was plummeting. Can you guess who ? Retail traders.
The pros, for whatever reason, had decided that was a nice place to take profits from. And the retail traders who were convinced the market was still 'mooning' were jumping right in and soaking up all those sell orders. Who do you think made money here ?

For the next couple of candles there's huge indecisions in the market. Big wicks all over the place, no-one knows what to do. That's fairly evident when you blend the candles (another article I've been promising to write about). If you see a huge doji at the top of an uptrend it can signal a change in market direction. Just because the 'doji' formed over the course of a few candles instead of one, it still means the same thing. All you're doing is looking at the same chart but on a different timescale. It's a handy skill to learn, looking at higher timeframe charts on the lower, by mentally 'blending' the candles.

After all the fuss has died down, the market falls into a range again.

Something to note here, look where support formed at the bottom of the range, it coincides with the 50% retracement level from the first 'upthrust'. It could be coincidence, but 50% retracement levels tend to hold quite well. It could have been possible in advance to draw this support line after the first upthrust formed, and before the market even peaked. It's always worth drawing these lines in the chart. As I said, it could have just been coincidence but these kind of things happen a lot, and anything that pushes the odds in your favour is a good thing.
Even if they only worked 55% of the time, slightly more than average, if you traded off that line then you're adding another 5% chance of success for your trade. Just something to keep in mind.

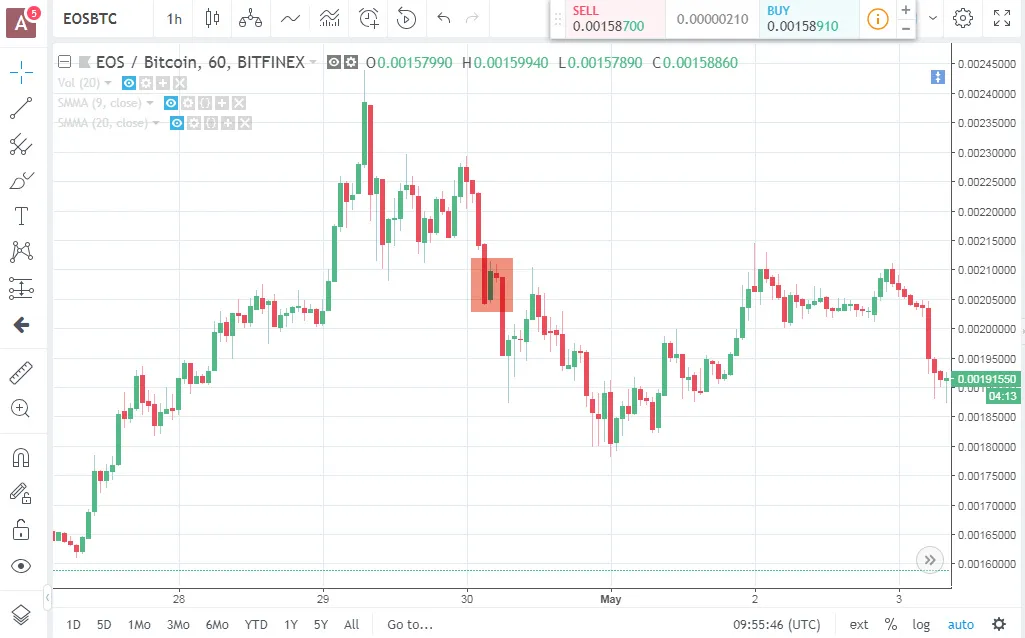
The next significant thing to note during that ranging period is the first pinbar, highlighted below. Some people would have thought that meant the price was going to go down and it did, but you shouldn't trade off them.

The thing is, once you see a pinbar, it's too late !. You've missed the trade. Everyone would have been waiting for confirmation of that pinbar, by the next candle breaking the low. That's a retail traders entry. If you didn't manage to buy at the very top of that wick, trades over, you missed it. Look at the awful risk reward ratio you would have got if you sold below the low of the pinbar with the stop above the high of it, just terrible.
At most, you could maybe have made a 1:1.5 R:R on that, not worth it. The people who managed to sell at the top of the wick would have done a lot better, maybe 1:10 or better. Don't forget, for the price to get there and back, some people were selling and some people were buying, guess which ones made the most money.
Ok, some other things to note. You could have made some quick trades throughout that ranging period, but only if you bought right at the bottom of that range, or sold right at the top. If you look at the support line when it first formed a low, you could have put a buy order on and hoped the price would have came back and triggered it.

But the price didn't, so nothing lost. That's pretty important, missing out on a trade is better than making a bad trade and losing money. The price came back down but never filled the order. C'est la vie ! Nothing lost, market will still be there tomorrow.

Note that the price made a higher low, which is why the buy never got filled, which could indicate instead that there is pressure to the upside and the trend up might continue. BUT ! don't forget about that pinbar... The price came all the way down off that huge high and then went back up to that pinbar high, but it didn't go any higher. That could indicate the bears are taking control, keeping the price down.

So I said pinbars are useless and you shouldn't trade them which is true, but they do serve a very good function. They literally point at where the sellers are ! You know that when the price got to that level it triggered a lot of sell orders which pushed the price all the way down.

What do you think might happen when price gets back up to that level where all the sellers were ? There's a good possibility that all the people who didn't get their sell orders filled still have them on the system. And all the people who didn't have orders on and saw what happened, they'll put a bunch of new sell orders on at that point because they're pissed they missed out the first time.
Look what happened then when that level got hit again, it started a bear run that destroyed all those uptrends in a couple of candles. If you had managed to get a sell order on there, near the high of that pinbar wick, you could have been looking at a 1:40 R:R or higher, depending on how risky a stop level you used.

Carrying on...The next bit is the big bear run, which is kinda where you got involved. I marked it on the cross below.

You bought around there, expecting the market to turn around and head back up. I believe the pinbar was what alerted you to the possibility ? As I said above, pinbar entries are for retail traders, if you didn't have a buy order waiting at the low of that pinbar wick then tough, too late, you missed it. How would you know where to put the buy order in advance ? That's another story...
What you should have noticed first is the general trend, lower highs and lower lows which signifies 'downtrend'. Not a good place to be putting buy orders.

Until the chart tells you otherwise, the trend continues in the same direction. People get wiped out trying to guess trend changes and it's virtually impossible to figure them in advance. It's only looking at charts in hindsight, like we're doing now, that you can see them. Yet people insist on trying to trade them. Just go with the flow, a trend is a trend until it's not.
There's another little price action trade in that section that I'll highlight below. As above, a trend is always impulse > correction, impulse > correction. So if you missed the downtrend off that pinbar high before, you could wait for a pullback in the trend and get a sell order in. That little pullback halfway down would have been ideal.
If you had a sell order near the high of that pullback you could have entered the downtrend with a very small risk and high reward.

OK, enough for now, my fingers are getting tired lol. I could go on and on and demostrate other price action principles but I just wanted to give you an idea of trading without indicators. I'll sum it up a bit.
Very easy to say all this in hindsight, but I just wanted to show you the kind of thought processes for price action trading. It would have been possible to make some really great trades on this chart from price action alone. No indicators, no systems, just reading the chart and using common sense.
You just need to identify the trends and work out where all the buyers and sellers are. You never buy at market but use market orders to enter trades, let the price carry you into a trade, don't just buy on a whim. Be aware of 'professional entries' and 'retail entries'. It's much better to make lots of small losses with high risk for those huge winning trades. Retail traders do it the other way round, almost guaranteed trades but for shit rewards, if any.
You need to take risks to get rewards, as long as the rewards are much much bigger than the risks. I'm kinda trying to condense years and years of trading into one post here so I'll stop now, a lot of it just comes down to intuition after a while anyway.
I fully expect that another price action trader could come along and rubbish everything I've said, which is absolutely fine. If what they do makes money for them, then that's the right way to trade for them. If someone wants to use Elliot Wave anaysis or consult the I Ching (same thing, lol) then that's their trading method. Your bottom line is all that matters.
Any questions then please feel free below, and you owe me a bloody beer or something, lol.