Repository
https://github.com/to-the-sun/amanuensis
This development contribution is submitted in association with task request by 
Link to the task request
What is Amanuensis?
The Amanuensis is an automated songwriting and recording system created by
New Feature
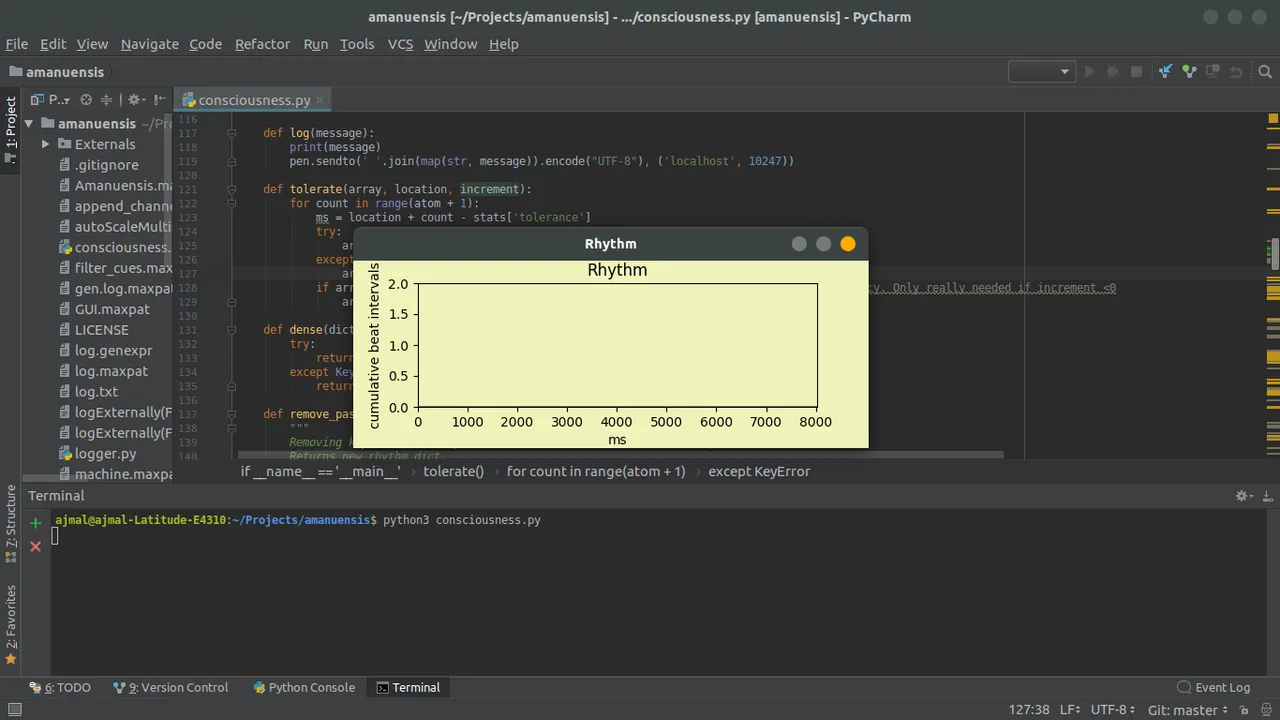
The graph
I implemented a graph for plotting the values in the dictionary rhythm. Rhythm dictionary acted as a sparse array which gets updated as the time passes when the user starts recording. I had to plot the plot the data stored in the rhythm dictionary from the moment referred in spout[0]. The graph should also have to be updated in real time so I was needed to clear the plotted data after the plotting has been done. Matplotlib was used to plot the graph.
Implementation
Python script: https://github.com/to-the-sun/amanuensis/blob/master/consciousness.py
To make the graph real time I created a separate process using Python's multiprocessing library. Also, a queue was created to pass the data to be plotted to the drawing_process in real time. The Queue was made non-blocking to prevent the graph window from freezing, waiting for new data.
Relevant codes
Funtion for graph drawing process
def draw(queue):
    """
    Process to draw & update the graph.
    """
    # Initializing Graph
    xlim = stats['wake'] + 25
    ylim = 2
    plt.ion()

    figure = plt.figure()
    figure.subplots_adjust(bottom=0.22)
    figure.patch.set_facecolor('#eff3b9')
    figure.canvas.set_window_title('Rhythm')
    axes = figure.add_subplot(111)
    axes.set_facecolor('#eff3b9')
    axes.set_xlim([0, xlim])
    axes.set_ylim([0, ylim])
    axes.set_title('Rhythm')
    axes.set_xlabel('ms')
    axes.set_ylabel('cumulative beat intervals')
    try:
        x_data, y_data = queue.get(False)
    except que.Empty:
        x_data, y_data = new_data()
    l, = axes.plot(x_data, y_data, '#757981')
    manager = figure.canvas.manager
    manager.window.wm_geometry("+{}-{}".format(10, 20))
    manager.resize(550, 200)
    figure.canvas.draw()
    figure.canvas.flush_events()

    # Update Loop
    while True:
        try:
            x_data, y_data = queue.get(False)
            ylim = np.amax(y_data) + 1
            axes.set_ylim([0, ylim])
            if stats['wake'] > xlim:
                xlim = stats['wake'] + 25
                axes.set_xlim([0, xlim])
            l.set_xdata(x_data)
            l.set_ydata(y_data)
            figure.canvas.draw()
            figure.canvas.flush_events()
        except que.Empty:
            try:
                figure.canvas.start_event_loop(0.5)
            except TclError:
                print("Graph closed!")
                break
        except TypeError:
            pass
        except TclError:
            break
Function to prepare new data for plotting.
def new_data(keys=None, values=None):
      """
      Function to prepare data for plotting the graph.
      """
      ydata = np.zeros(stats['wake'] + 25, dtype='int')
      xdata = np.linspace(0, stats['wake'] + 25, stats['wake'] + 25, dtype='int')
      if keys is not None:
          i = 0
          j = 0
          while j < len(values):
              try:
                  if i in keys:
                      ydata[i] = values[j]
                      j += 1
                  i += 1
              except Exception:
                  break
      return xdata, ydata
Removing plotted values from the rhythm dictionary after plotting.
def remove_past_moments(r_dict, spout):
        """
        Removing keys from the rhythm dict which denotes moments in the past
        Returns new rhythm dict.
        """
        for key in r_dict.copy():
            if key - spout < 0:
                r_dict.pop(key)
        return r_dict
Preparing new plot data and sending it via the queue
try:
       # Stripping off past moments from the rhythm dict.
       rhythm = remove_past_moments(rhythm, spout[0])
       lists = sorted(rhythm.items())
       x, y = zip(*lists)
       x = np.array(x) - spout[0]
       x, y = new_data(x, y)
except ValueError as v:
       pass
except Exception as e:
       print(e)
finally:
       try:
              q.put((x, y))
       except Exception as e:
              print(e)
A working implementation of the graph can be seen in this video: Video Link