I am generating this data to how to us how much Steemit did growth from the start to now. I am generating this data from 
Details of analysis that i have gathered
- Extracted Data at 11/22/2017 2:00PM PH Time
- Total Accounts created per month and year
- Total Post created per month and year
- Top 20 categories and how many are created
- Tables, Graphs and Chart created for visual presentation
Why i did generate this data?
I did generate this data to know the exact figures and the development of the community. Community members can help the exposure and popularity of the site by sharing their experiences and how Steemit change their lives. With new people coming , the continuous growth of Steemit will surely be recognized.
Accounts created per month per year
Table View
On the table view we can see how user registrations rise up after Steemit has been released to the public and did make a slow down after several months . Sometimes with the hype of the site helps public exposure, and also many people still not yet exposed to cryptocurrency.
With still on its beta stage sure Steemit will have a potential growth, surely on the following months Steemit will regain back it's popularity once people are being educated how cryptocurrency works.
| Year | Month | Accounts |
|---|---|---|
| 2016 | March | 744 |
| 2016 | April | 15,562 |
| 2016 | May | 8,608 |
| 2016 | June | 8,387 |
| 2016 | July | 9,792 |
| 2016 | August | 15,053 |
| 2016 | September | 7,613 |
| 2016 | October | 8,346 |
| 2016 | November | 8,072 |
| 2016 | December | 4,913 |
| 2017 | January | 4,902 |
| 2017 | February | 1,464 |
| 2017 | March | 1,830 |
| 2017 | April | 1,976 |
| 2017 | May | 1,769 |
| 2017 | June | 1,469 |
| 2017 | July | 1,922 |
| 2017 | August | 2,585 |
| 2017 | September | 2,615 |
| 2017 | October | 2,151 |
| 2017 | November | 1,575 |
2016 Created Users - View in Graph
In this graph we have generated 2016 user created accounts, as we can see April has been the most people signing up an account in Steemit and slows down and back its trend on the month of August.

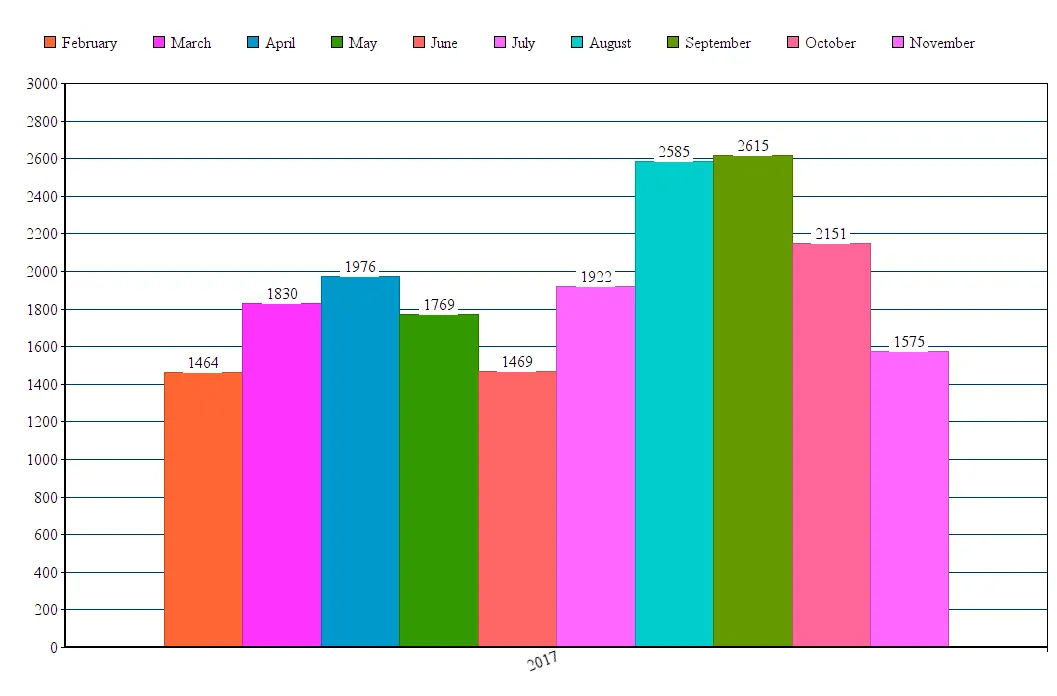
2017 Created Users - View in Graph
In this graph , we can see that people have slow down signing up new accounts and continuously decreasing every month if we compare this to the previous year.
2016 Created Users - View in Pie Graph
In this Pie Graph we can see that around April 18.87% are created comparing to the entire year of 2016.

2017 Created Users - View in Pie Graph
In this Pie Graph for the year 2017 , the month of January have around 20.21% created total accounts and then signing up process for new accounts slowing decreasing on the following months.

2016 vs 2017 Created Users
| Year | Total Created Accounts |
|---|---|
| 2016 | 87090 |
| 2017 | 24258 |

Recommendation :
With the tremendous drop of number of signups. I think Steemit needs to be market more into the public showing what the community is capable of. As per statistic comparison 2016 has around 78.21% while 2017 has around only 21.79%
Total number of posted articles per year , per month
Table View
| Year | Month | Total Post |
|---|---|---|
| 2016 | March | 3 |
| 2016 | April | 1,101 |
| 2016 | May | 13,446 |
| 2016 | June | 20,140 |
| 2016 | July | 342,288 |
| 2016 | August | 433,366 |
| 2016 | September | 259,821 |
| 2016 | October | 195,113 |
| 2016 | November | 179,961 |
| 2016 | December | 198,222 |
| 2017 | January | 218,741 |
| 2017 | February | 182,790 |
| 2017 | March | 246,890 |
| 2017 | April | 213,819 |
| 2017 | May | 724,878 |
| 2017 | June | 2,465,293 |
| 2017 | July | 3,124,660 |
| 2017 | August | 2,754,524 |
| 2017 | September | 2,572,672 |
| 2017 | October | 2,371,066 |
| 2017 | November | 1,809,782 |
Graph View
As we can see in the graph , people are less creating articles on the primary stages steemit and begin to have huge increase of created post at the month of May 2017. The increase of transaction greatly increase steemit's popularity to the public.

Pie View
As we can see in the pie view, around June 2017 there is a huge increase of percentage of people creating articles.

Top 20 article tags
Table View
Most people in this community create more articles about their photography for this is the most easy way to create articles, you just need to put a photo on it without any details. With too many competition also in the tagged article , it is very hard for each individual to earn from it , even if the article is a quality one. There are some cases that low quality articles are being upvoted by many even if there are still many articles that are better.I feel sorry sometimes to the author , dedicating a long hours of editing such quality post and just earning cents.
| Category | Total articles created |
|---|---|
| photography | 1,203,575 |
| steemit | 1,169,865 |
| life | 911,551 |
| introduceyourself | 795,781 |
| kr | 766,621 |
| art | 587,005 |
| bitcoin | 531,322 |
| travel | 462,026 |
| food | 449,023 |
| spanish | 341,253 |
| cryptocurrency | 330,752 |
| steem | 272,043 |
| colorchallenge | 265,188 |
| news | 249,332 |
| funny | 231,173 |
| cn | 199,282 |
| music | 164,750 |
| blog | 151,492 |
| health | 139,373 |
| nature | 136,427 |
Pie View
As we can see on the pie graph, we can see that both photography and steemit tags has really gained popularity and still being used up to now. There are cases that due to huge number of articles created to poplar tags daily, new ones will out of exposure in just a minute. Sometimes you need to have more followers as an alternative option that your article will be seen on their feeds.

Final Analysis
- We need more exposure for Steemit to gain more users in the community
- Current users are now more active that they are on previous months
- Immediate out of exposure to most articles that are tagged with trending tags
- Steemit needs more advertisement or public exposure
Posted on Utopian.io - Rewarding Open Source Contributors