
Crypto Contest September 30: Xaurum
Xaurum (HitBTC: XAURETH) has broken out of the triangle pattern in the weekly chart.
[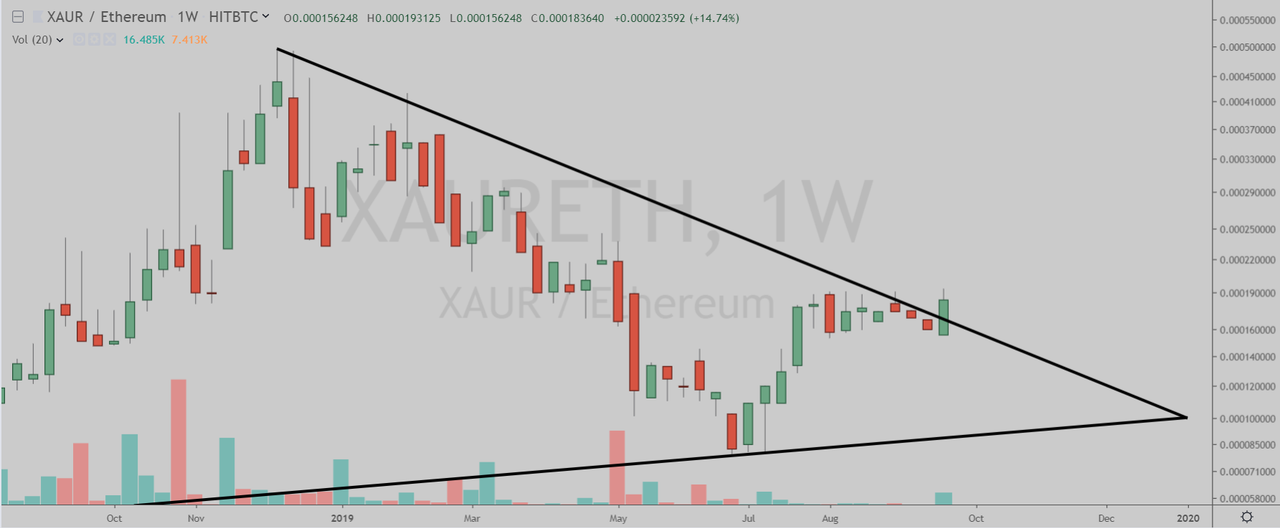](https://postimg.cc/ZCv4g1mp)
(Chart courtesy of Tradingview.com (log scale))
**Elliott Wave Analysis**
In Elliott Wave terms, Xaurum began a wave one advance in May 2018. The red wave one (blue sub-waves i-ii-iii-iv-v) finished in December 2018, and the red wave two (blue sub-waves a-b-c) correction ended in June this year. If this wave count is correct, Xaurum should be heading next towards the December 2018 peak in the red wave three.
[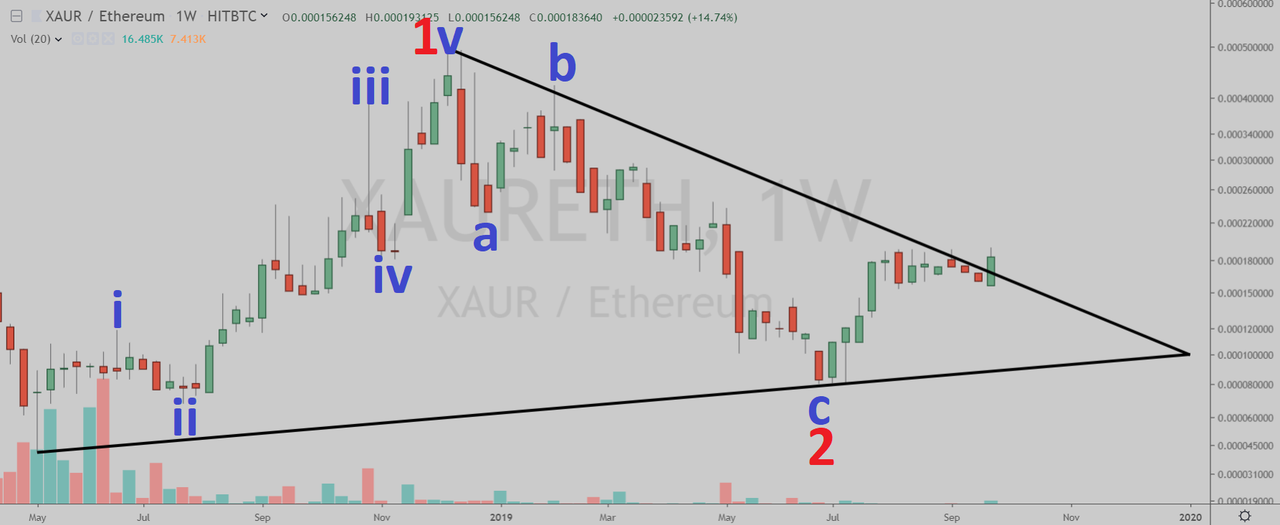](https://postimg.cc/VJ1sCKyt)
(Chart courtesy of Tradingview.com (log scale))
**Funnymentals**
Xaurum is a digital asset with a continuously growing gold base. You can watch their intro video below.
<iframe width="560" height="315" src="https://www.youtube.com/embed/DQBEn93XDwc" frameborder="0" allow="accelerometer; autoplay; encrypted-media; gyroscope; picture-in-picture" allowfullscreen></iframe>
(Sources: https://www.xaurum.org)
**How Will Xaurum Trade?**
Xaurum (HitBTC: XAURETH) weekly chart by Tradingview.
[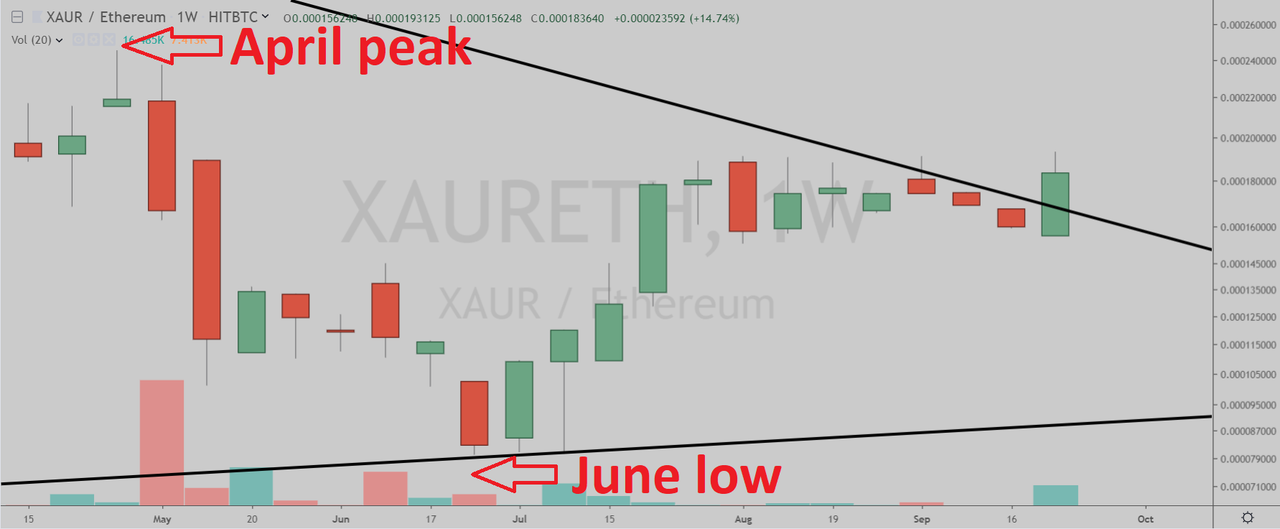](https://postimg.cc/t7k7z055)
(Chart courtesy of Tradingview.com (log scale))
**Prizes**
I will be giving upvotes to the correct answers with minimum reputation of 25.
**Rules**
This poll will expire in one week. Only one vote per person.
**Which one will happen first?**
Please select one of the three choices.
$ 0.000
5

$ 0.081
5

$ 0.000
2

$ 0.667
41