Hello dear Hivers,
Diary of the last week
This week I worked on the homepage of my customer, Openclawbot (I made some good progress, more later) and had a few days of with my friends from USA. We were in our flat and had a great time in the Eifel.

Here are the
$ALIVE Statistics For The Last 7 Days, 2026-02-27 to 2026-03-06:
Who has bought how many $ALIVE at which time:

Top $ALIVE Buyers And $HIVE Sellers
The inside of the circle shows the buyers of $ALIVE, ordered by $HIVE they have spent. The outside shows the recipients of that $HIVE (sellers of $ALIVE):

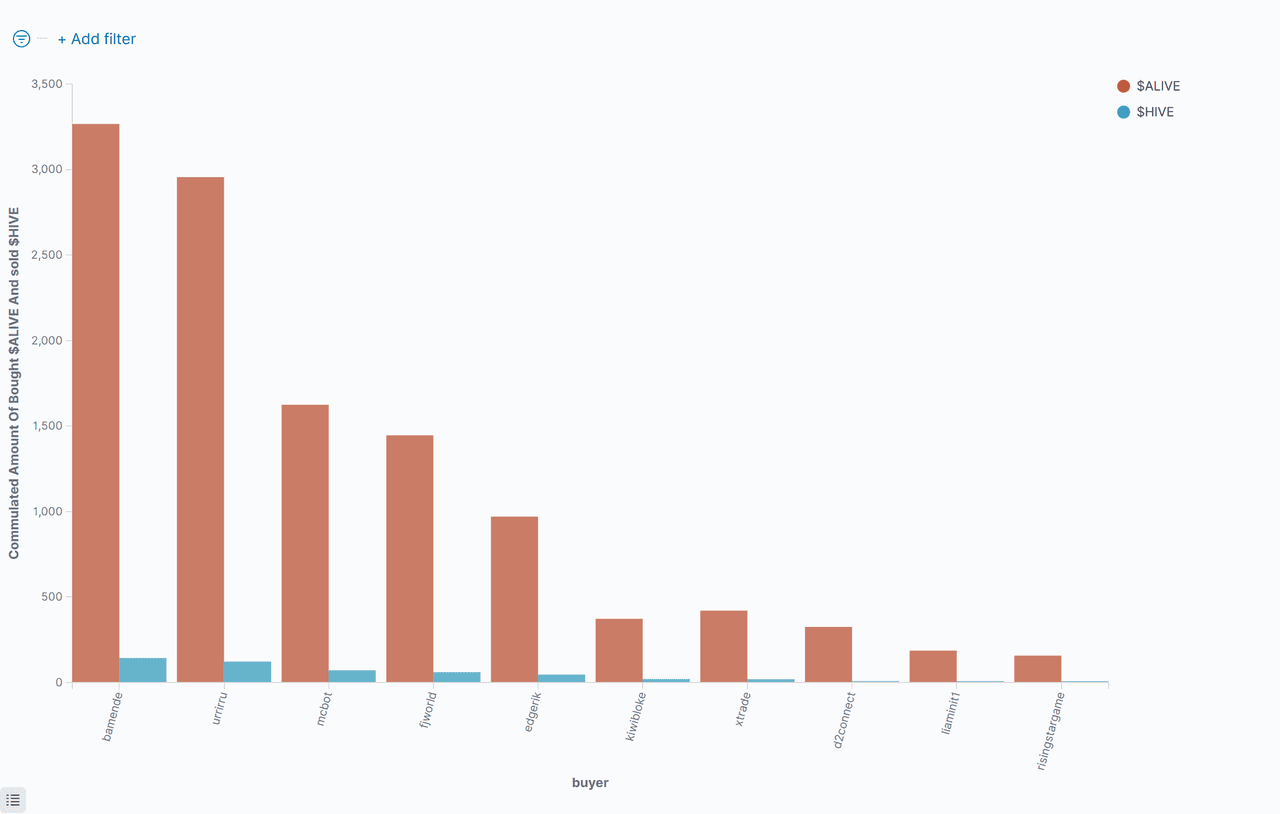
Comulated Amount Of Bought $ALIVE Per Person
Top 10 $ALIVE buyers, how much they got and how much $HIVE they spend for this. Sorted by $HIVE, that was spent:
Top 20 $ALIVE Buyers
Sorted by the $HIVE, they have spent:


Comulated Amount Of Sold $ALIVE Per Person
Top 10 $ALIVE Sellers, how much they sold and how much $HIVE they got for this, sorted by $HIVE:

Top 20 $ALIVE Sellers
Sorted by the $HIVE, they have got:


Price Of The $ALIVE

$ALIVE Summarize Metrics

| Request | Received Hive | Received HIVE % | Sold $ALIVE | Avg. Price |
|---|---|---|---|---|
| sell | 350.28609 | 58.20% | 8041.93710 | 0.04404 |
| buy | 251.55852 | 41.80% | 5695.01495 | 0.04600 |
| sum: | 601.84461 | 100% | 13736.95205 | 0.04502 |
CoinmarketCap


Links:
How I Have Set Up Elasticsearch And Kibana On My Raspberry Pi To Monitor Token Activities and here: Do You Want To See Statistics Of Your Favorite HIVE Token? or on github.
@advertisingbot2/posts?filter=stats
@achimmertens
https://github.com/achimmertens
Achim Mertens