Total Number of Posts and Participants
| Number of Posts | Number of Participants | Weekly Changes, % | |
|---|---|---|---|
| #foodphotography | +4.3 % | ||
| #animalphotography | |||
| #landscapephotography | +13.9 % | ||
| #cityscapephotography | +20.3 % | ||
| #architecturalphotography | |||
| #vehiclephotography | +13.7 % | ||
| #macrophotography | |||
| #colourfulphotography | |||
| #streetphotography | |||
| #portraitphotography | +27.2 % | ||
| #sportsphotography | +2.9 % | ||
| #smartphonephotography | +11.1 % | ||
| #goldenhourphotography | +59.6 % | ||
| #longexposurephotography | +113.4 % |

Number of Participants
posting in both Contests of the Day
| Participants in both contests | |
|---|---|

Number of Participants all Day
| Participants all day | Weekly Change, % | |
|---|---|---|
+12.7 % | ||
+9.4 % | ||
+63.2 % |

Histogram of Number of Posts every 15 minutes
The data represents the CET (UTC+1), which is the official time zone for 


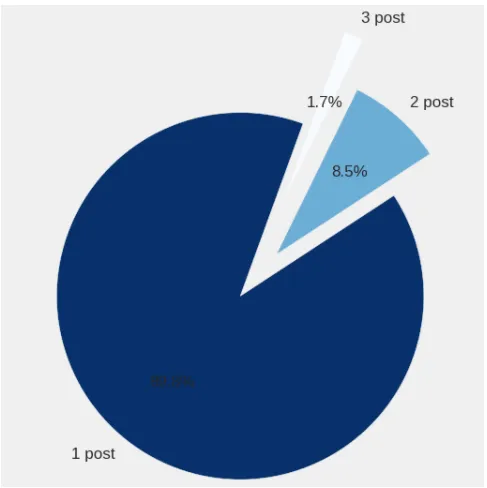
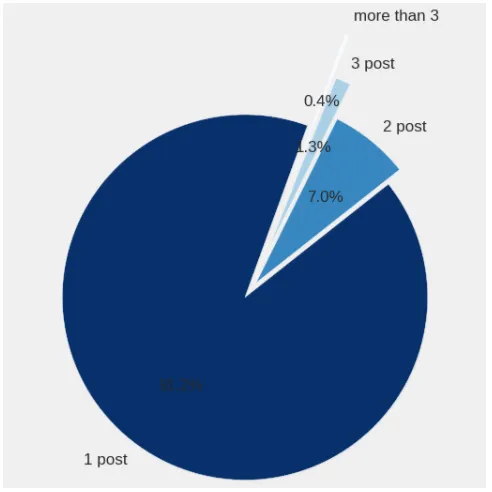
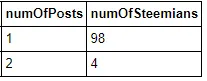
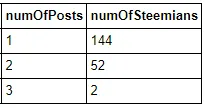
Number of Participants and their Number of Posts
Monday


Tuesday


Wednesday


Thursday


Friday


Saturday


Sunday


Background Info
I have extracted the data using api.steemit.com and the following api call:
payload = '{"id":4,"jsonrpc":"2.0","method":"call","params":["database_api","get_discussions_by_created", [{"tag":"' + tag + '","limit":100}]]}'
I am using pandas library. Pandas is an open source and is designed for Python users for data analysis and manipulation.
Monday: foodphotography and animalphotography
Tuesday: landscapephotography and cityscapephotography
Wednesday: architecturalphotography and vehiclephotography
Thursday: macrophotography and colourfulphotography
Friday: streetphotography and portraitphotography
Saturday: sportsphotography and smartphonephotography
Sunday: goldenhourphotography and longexposurephotography