$ 0.043
5
$ 0.087
13
$ 0.000
8
$ 15.389
91
$ 6.423
99
$ 6.164
139
$ 0.667
41
$ 0.000
1
$ 0.000
4
$ 7.669
36

Crypto Contest November 3: Augur
Augur (Bittrex: REPUSD) has broken out of the triangle pattern in the daily chart.
[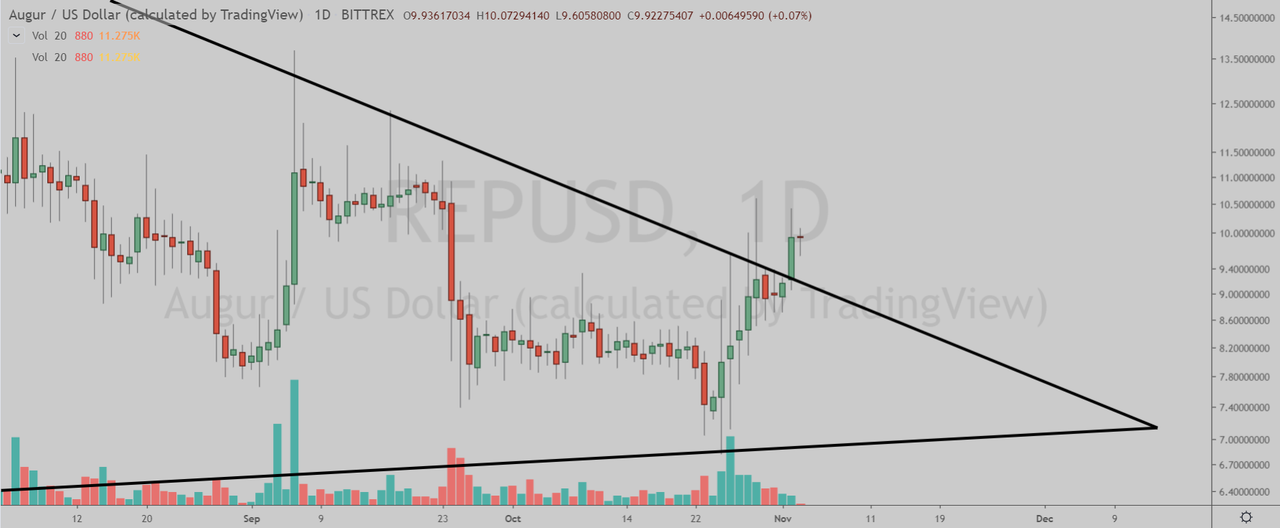](https://postimg.cc/JHX8tp41)
(Chart courtesy of Tradingview.com (log scale))
**Elliott Wave Analysis**
In Elliott Wave terms, REP began a wave one advance in December 2018. The red wave one (blue sub-waves i-ii-iii-iv-v) finished in April this year, and the red wave two (blue sub-waves a-b-c) correction ended in October. If this wave count is correct, REP should be heading next towards the May peak in the red wave three.
[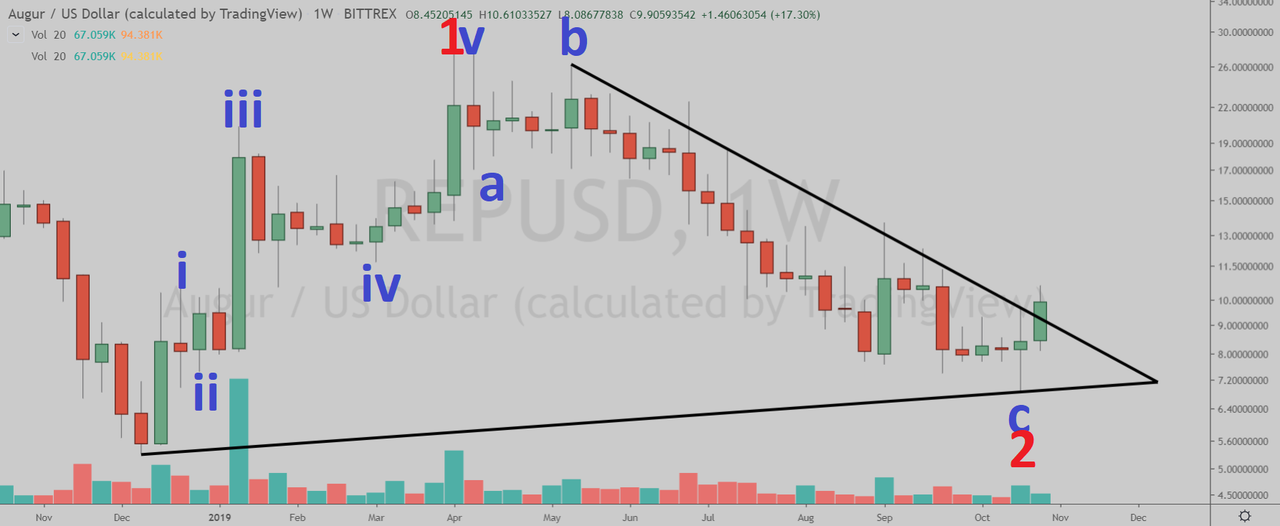](https://postimg.cc/sGfVHYVy)
(Chart courtesy of Tradingview.com (log scale))
Zooming out in the weekly chart, I believe REP is currently in the red wave three. The red wave three began in December 2018.
[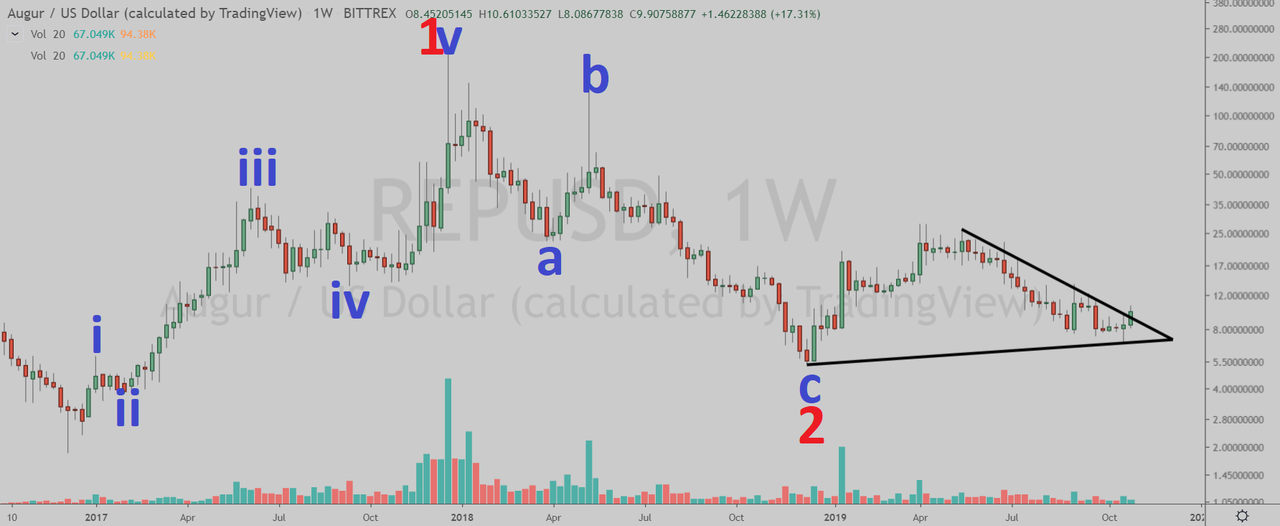](https://postimg.cc/grG38jCH)
(Chart courtesy of Tradingview.com (log scale))
**Funnymentals**
Augur is a decentralized oracle and peer to peer protocol for prediction markets. You can read their latest weekly report [here](https://augur.substack.com/p/augur-weekly-warrens-presidential).
[](https://postimg.cc/yWFs4Yxt)
(Sources: https://www.augur.net/)
**How Will Augur Trade?**
Augur (Bittrex: REPUSD) daily chart by Tradingview.
[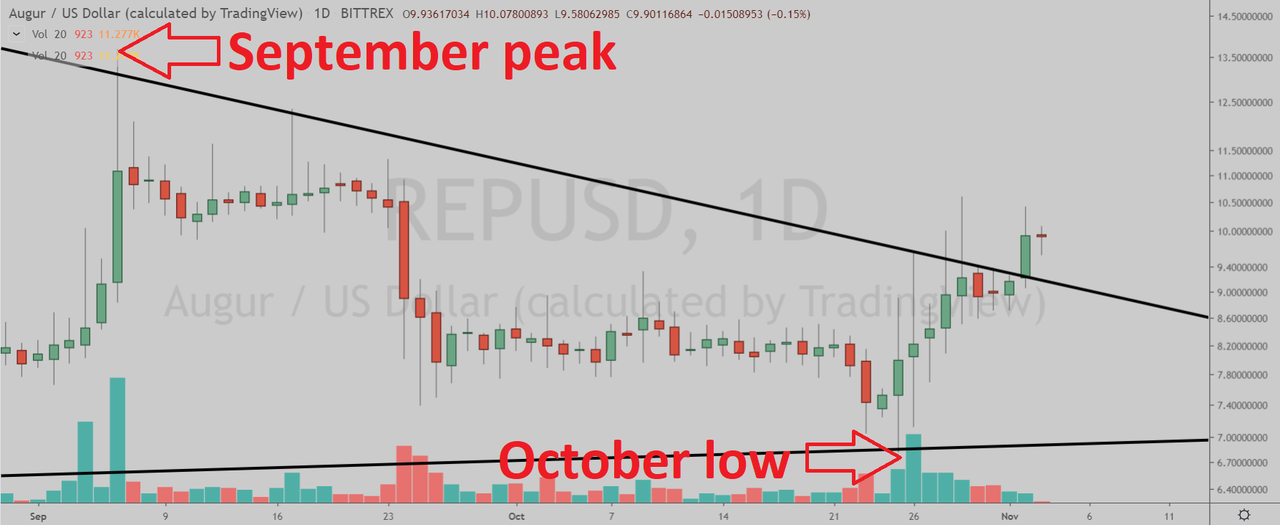](https://postimg.cc/2qmXWrrb)
(Chart courtesy of Tradingview.com (log scale))
**Prizes**
I will be giving upvotes to the correct answers with minimum reputation of 25.
**Rules**
This poll will expire in one week. Only one vote per person.
**Which one will happen first?**
Please select one of the three choices.
DEVELOPMENT - track breakout, buy at pullback! » Update • Oct 22 2019 | 21:07:52 UTC - [Community's Swing Trading Blog] «
[Update • Oct 22 2019 | 21:07:52 UTC] : Steemit's Community Swing Trading Blog Hello there! I’m Steemit's Swing Trading Bot, built for the community. I retrieve my data directly from tradingview. Every
$ 0.000
3